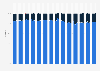
This statistic shows the average number of apps installed by smartphone users in Spain as of February 2019, by age. Smartphone users aged between 18 to 24 years had around eleven installed apps on their smartphones during the period under consideration.
Average number of smartphone apps installed in Spain as of February 2019, by user age
Basic Account
Get to know the platform
You only have access to basic statistics.
This statistic is not included in your account.
Starter Account
The ideal entry-level account for individual users
- Instant access to 1m statistics
- Download in XLS, PDF & PNG format
- Detailed references
$69 USD $39 USD / Month *
in the first 12 months
Professional Account
Full access
Business Solutions including all features.
* Prices do not include sales tax.
Statistics on Smartphones in Italy
Overview
6
- Premium Statistic Consumer electronics revenue in Italy from 2020 to 2026
- Premium Statistic Mobile phone market revenue in Italy 2016-2026
- Premium Statistic Number of smartphone users in Italy 2017-2025
- Premium Statistic Smartphone user penetration rate in Italy 2017-2025
- Premium Statistic Mobile cellular subscriptions per 100 capita in Italy 2010-2025
- Premium Statistic Average smartphone price in Italy 2013-2026
Companies
5
- Premium Statistic Leading mobile device vendors in Italy 2016-2021, by market share
- Premium Statistic Leading mobile operating systems ranked by market share in Italy 2010-2021
- Premium Statistic Apple iOS market share in Italy 2016-2022
- Premium Statistic Android OS market share in Italy Q2 2017-Q4 2021, by version
- Premium Statistic Most popular smartphone brands in Italy 2022
Consumption
4
Mobile broadband
6
- Premium Statistic Mobile network revenues of telecommunication operators in Italy 2013-2021
- Premium Statistic Revenues from mobile data services 2013-2021, by service type
- Premium Statistic Revenue per unit of mobile data services in Italy 2013-2021
- Premium Statistic Mobile data traffic in Italy 2013-2020
- Premium Statistic Average monthly SIM cards' data traffic in Italy 2012-2021
- Premium Statistic Most common mobile data plans in Italy 2022
Mobile carriers and SIM cards
7
- Premium Statistic Market share of mobile network providers in Italy 2021
- Premium Statistic Market share of mobile network providers in Italy 2021, by segment
- Premium Statistic Smartphone by mobile carrier / brand in Italy 2022
- Premium Statistic Satisfaction with mobile carrier in Italy 2022
- Premium Statistic Number of SIM cards in Italy 2014-2021
- Premium Statistic Distribution of SIM cards in Italy 2014-2021, by contract type
- Premium Statistic Mobile ARPU per SIM card 2013-2021, by service type
Special focus: 5G
5
- Premium Statistic Share of mobile connections in Italy 2020-2025, by technology
- Premium Statistic Total costs of 5G eMBB deployment in Italy 2020, 2025 and 2040
- Premium Statistic 700MHz (5G) coverage in Italy 2023 and 2025
- Premium Statistic 3.5GHz (5G) coverage in Italy 2023-2025
- Premium Statistic Share of macro sites in Italy with rolled-out 700MHz and 3.5GHz (5G) 2023-2030
Further related statistics
18
- Smartphones: number of apps installed Spain 2019
- Smartphone and tablet users' reasons to uninstall apps in Spain 2016
- Paid apps: purchases by smartphone and tablet users Spain 2016
- Distribution of smartphone users by number of installed apps in Ireland 2014
- Share of smartphone users by number of installed apps in Ireland 2014, by age
- Volume of push notifications that prompt U.S. users to stop using an app 2017
- Monthly app downloads of U.S. smartphone users 2017
- China's third-party Android stores preferred by mobile users 2018
- Global Google Play app installs 2017, by source
- Number of apps users report being installed on their smartphones in the UK 2016
- Leading app permissions in the Google Play Store 2014
- Global Apple App Store app installs 2017, by source
- Number of apps downloaded in the United Kingdom (UK) 2013
- Digital service experiences of smartphone users Japan 2019, by type
- Average time from global shopping apps install to register 2018, by type
- Gender profile of smartphone users in the United Kingdom (UK) 2015, by OS
- App-updating habits of smartphone users in the United States 2016
- Share of global paid app installs 2018-2019, by vertical
Further Content: You might find this interesting as well
Statistics
- Smartphones: number of apps installed Spain 2019
- Smartphone and tablet users' reasons to uninstall apps in Spain 2016
- Paid apps: purchases by smartphone and tablet users Spain 2016
- Distribution of smartphone users by number of installed apps in Ireland 2014
- Share of smartphone users by number of installed apps in Ireland 2014, by age
- Volume of push notifications that prompt U.S. users to stop using an app 2017
- Monthly app downloads of U.S. smartphone users 2017
- China's third-party Android stores preferred by mobile users 2018
- Global Google Play app installs 2017, by source
- Number of apps users report being installed on their smartphones in the UK 2016
- Leading app permissions in the Google Play Store 2014
- Global Apple App Store app installs 2017, by source
- Number of apps downloaded in the United Kingdom (UK) 2013
- Digital service experiences of smartphone users Japan 2019, by type
- Average time from global shopping apps install to register 2018, by type
- Gender profile of smartphone users in the United Kingdom (UK) 2015, by OS
- App-updating habits of smartphone users in the United States 2016
- Share of global paid app installs 2018-2019, by vertical
IAB Spain. (February 10, 2019). Average number of smartphone apps installed in Spain as of February 2019, by user age [Graph]. In Statista. Retrieved April 01, 2023, from https://www.statista.com/statistics/751039/smartphones-number-of-apps-installed-in-spain-by-user-age/
IAB Spain. "Average number of smartphone apps installed in Spain as of February 2019, by user age." Chart. February 10, 2019. Statista. Accessed April 01, 2023. https://www.statista.com/statistics/751039/smartphones-number-of-apps-installed-in-spain-by-user-age/
IAB Spain. (2019). Average number of smartphone apps installed in Spain as of February 2019, by user age. Statista. Statista Inc.. Accessed: April 01, 2023. https://www.statista.com/statistics/751039/smartphones-number-of-apps-installed-in-spain-by-user-age/
IAB Spain. "Average Number of Smartphone Apps Installed in Spain as of February 2019, by User Age." Statista, Statista Inc., 10 Feb 2019, https://www.statista.com/statistics/751039/smartphones-number-of-apps-installed-in-spain-by-user-age/
IAB Spain, Average number of smartphone apps installed in Spain as of February 2019, by user age Statista, https://www.statista.com/statistics/751039/smartphones-number-of-apps-installed-in-spain-by-user-age/ (last visited April 01, 2023)
Average number of smartphone apps installed in Spain as of February 2019, by user age [Graph], IAB Spain, February 10, 2019. [Online]. Available: https://www.statista.com/statistics/751039/smartphones-number-of-apps-installed-in-spain-by-user-age/