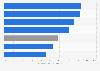
In 2022, Wonju-si had the largest population among 18 districts in Gangwon Province in South Korea, with around 361.8 thousand inhabitants. That year, the total population of Gangwon Province stood at about 1.53 million.
Population distribution of Gangwon Province, South Korea in 2022, by district
(in 1,000 inhabitants)
Characteristic
Population in thousand inhabitants
-
-
-
-
-
-
-
-
-
-
-
-
-
-
-
-
-
-
-
-
-
-
-
-
-
-
-
-
-
-
-
-
-
-
-
-
-
-
Exclusive Premium Statistic
To access all Premium Statistics, you need a paid Statista Account
Profit from the additional features of your individual account
Currently, you are using a shared account. To use individual functions (e.g., mark statistics as favourites, set
statistic alerts) please log in with your personal account.
If you are an admin, please authenticate by logging in again.
Learn more about how Statista can support your business.
KOSIS. (July 27, 2023). Population distribution of Gangwon Province, South Korea in 2022, by district (in 1,000 inhabitants) [Graph]. In Statista. Retrieved July 27, 2024, from https://www.statista.com/statistics/755566/south-korea-population-distribution-of-gangwon-by-district/
KOSIS. "Population distribution of Gangwon Province, South Korea in 2022, by district (in 1,000 inhabitants)." Chart. July 27, 2023. Statista. Accessed July 27, 2024. https://www.statista.com/statistics/755566/south-korea-population-distribution-of-gangwon-by-district/
KOSIS. (2023). Population distribution of Gangwon Province, South Korea in 2022, by district (in 1,000 inhabitants). Statista. Statista Inc.. Accessed: July 27, 2024. https://www.statista.com/statistics/755566/south-korea-population-distribution-of-gangwon-by-district/
KOSIS. "Population Distribution of Gangwon Province, South Korea in 2022, by District (in 1,000 Inhabitants)." Statista, Statista Inc., 27 Jul 2023, https://www.statista.com/statistics/755566/south-korea-population-distribution-of-gangwon-by-district/
KOSIS, Population distribution of Gangwon Province, South Korea in 2022, by district (in 1,000 inhabitants) Statista, https://www.statista.com/statistics/755566/south-korea-population-distribution-of-gangwon-by-district/ (last visited July 27, 2024)
Population distribution of Gangwon Province, South Korea in 2022, by district (in 1,000 inhabitants) [Graph], KOSIS, July 27, 2023. [Online]. Available: https://www.statista.com/statistics/755566/south-korea-population-distribution-of-gangwon-by-district/