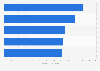
This statistic displays the number of employees in the metal industry in Spain in 2018, by subsector. In 2018, fabricated metal products had the largest workforce at under 237,000 employees. By contrast, the manufacture of computer, electronic and optical products amounted to some 26,500 people, some three percent of the metal industry workforce.
Number of employees in the metal industry in Spain in 2018, by subsector
Basic Account
Get to know the platform
You only have access to basic statistics.
This statistic is not included in your account.
Starter Account
The ideal entry-level account for individual users
- Instant access to 1m statistics
- Download in XLS, PDF & PNG format
- Detailed references
$189 USD $149 USD / Month *
in the first 12 months
Professional Account
Full access
Business Solutions including all features.
* Prices do not include sales tax.
Other statistics that may interest you Statistics on
About the industry
10
- Basic Statistic EU: turnover of metal forming machinery manufacturing 2011-2018
- Premium Statistic Machinery order value from the iron and steel industry in Japan FY 2012-2021
- Premium Statistic Amada: net sales 2013-2021
- Premium Statistic Sales of metalworking machinery in Denmark 2008-2018
- Basic Statistic EU: enterprises manufacturing metal forming machinery 2008-2016
- Basic Statistic EU: production value of metal forming machinery manufacturing 2008-2016
- Basic Statistic EU: turnover of paper production machinery manufacturing 2008-2015
- Premium Statistic Nippon Steel's profit FY 2013-2022
- Premium Statistic Toyota motor vehicle sales by region 2017-2023
- Premium Statistic Silver: production volume in the United Kingdom (UK) 2007-2021
About the region
10
- Premium Statistic Spain: used light commercial vehicle sales by segment 2021-2022
- Premium Statistic Lubricant sales volume in Spain 2010-2018
- Premium Statistic Turnover of the lubricant industry 2010-2018
- Premium Statistic Year-on-year growth in lubricant sales in Spain in 2018, by type
- Premium Statistic Spain: public EV charging infrastructure by autonomous community 2022
- Premium Statistic Spain: self-reported discouraging factors for EV purchase 2023
- Premium Statistic Spain: self-reported car purchasing intentions by fuel type 2023
- Premium Statistic Spain: Electric vehicle driving range expectations for car buyers 2023
- Basic Statistic Personnel costs of motor vehicle & trailer manufacturers in Spain 2011-2020
- Basic Statistic Turnover of machinery & equipment manufacturers in Spain 2011-2020
Other regions
10
- Basic Statistic Volvo Group - global revenue shares by region 2022
- Premium Statistic Revenue of the machinery and equipment industry in Italy by sector 2019
- Premium Statistic Amount of air pollutants emitted by excavators in China 2020, by type
- Basic Statistic EU: turnover of the machining industry 2008-2015
- Premium Statistic Sales volume of concrete batching plants China 2007-2017
- Premium Statistic Commercial/industrial equipment rental and leasing revenue in the U.S. 2005-2019
- Basic Statistic Number of registered vehicles in Norway 2020, by type
- Premium Statistic Ecuador: heavy vehicles sales volume 2009-2019
- Premium Statistic Export value of the machinery industry in Japan FY 2012-2020
- Premium Statistic Construction machinery manufacturing revenue in Canada 2012-2020
Related statistics
10
- Basic Statistic Number of tractors in Turkey 2007-2018
- Premium Statistic Leading motor vehicle manufacturers ranked by production-based sales in Turkey 2018
- Premium Statistic Air Canada's operating revenue 2013-2022
- Premium Statistic Lufthansa AG - revenue by segment 2022
- Premium Statistic Alaska Air - operating revenue 2011-2022
- Premium Statistic Revenue of Southwest Airlines 2010-2022
- Premium Statistic Registered passenger cars in Turkey 1995-2022
- Premium Statistic Stock of registered buses and minibuses in Turkey 1990-2022
- Premium Statistic Tata Steel UK annual revenue 2015-2022
- Basic Statistic North American vehicle production 1990-2022
Further Content: You might find this interesting as well
Statistics
Eurostat. (March 8, 2021). Number of employees in the metal industry in Spain in 2018, by subsector [Graph]. In Statista. Retrieved September 30, 2023, from https://www.statista.com/statistics/765100/employees-in-the-metal-industry-in-spain-by-segment/
Eurostat. "Number of employees in the metal industry in Spain in 2018, by subsector." Chart. March 8, 2021. Statista. Accessed September 30, 2023. https://www.statista.com/statistics/765100/employees-in-the-metal-industry-in-spain-by-segment/
Eurostat. (2021). Number of employees in the metal industry in Spain in 2018, by subsector. Statista. Statista Inc.. Accessed: September 30, 2023. https://www.statista.com/statistics/765100/employees-in-the-metal-industry-in-spain-by-segment/
Eurostat. "Number of Employees in The Metal Industry in Spain in 2018, by Subsector." Statista, Statista Inc., 8 Mar 2021, https://www.statista.com/statistics/765100/employees-in-the-metal-industry-in-spain-by-segment/
Eurostat, Number of employees in the metal industry in Spain in 2018, by subsector Statista, https://www.statista.com/statistics/765100/employees-in-the-metal-industry-in-spain-by-segment/ (last visited September 30, 2023)
Number of employees in the metal industry in Spain in 2018, by subsector [Graph], Eurostat, March 8, 2021. [Online]. Available: https://www.statista.com/statistics/765100/employees-in-the-metal-industry-in-spain-by-segment/