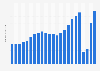
The average price per square meter of urban land in the Community of Madrid oscillated notably during the period under consideration. The price registered as of the third quarter of 2021 was 294.3 euros per square meter, a slight decrease compared to the previous quarter.
Average price per square meter of urban land in the Community of Madrid from 1st quarter 2016 to 3rd quarter 2021 (in euros per square meter)
Basic Account
Get to know the platform
You only have access to basic statistics.
This statistic is not included in your account.
Starter Account
The ideal entry-level account for individual users
- Instant access to 1m statistics
- Download in XLS, PDF & PNG format
- Detailed references
$69 USD $49 USD / Month *
in the first 12 months
Professional Account
Full access
Business Solutions including all features.
* Prices do not include sales tax.
Other statistics that may interest you
General outlook
6
- Premium Statistic Quarterly house price to rent ratio in Europe Q4 2020-Q4 2021, by country
- Premium Statistic Quarterly house price to rent ratio in Spain 2014-2022
- Premium Statistic Dwelling houses percentage by tenure type in Spain 2016-2020
- Premium Statistic Average rental prices in the Spanish housing market 2006-2021
- Premium Statistic Residential property to rent volume in Spain in 2021, by region
- Premium Statistic Leading Spanish provinces by volume of rented dwellings 2020
Rent prices
6
- Premium Statistic Income percentage used to pay the rent in Spain 2021, by region
- Premium Statistic Provinces of Spain with cheapest house rent per square meter as of November 2020
- Premium Statistic Provinces of Spain with expensive house rent per square meter as of July 2022
- Premium Statistic Leading Spanish cities with highest rental house prices in 2022
- Premium Statistic Leading Spanish cities with lowest rental house prices in 2023
- Premium Statistic Most expensive streets to rent a house Spain 2019
Investment in rental residential property
7
- Premium Statistic Return of investment rate in rental residential property in Spain 2010-2022
- Premium Statistic Most profitable cities for residential real estate investment Spain 2022
- Premium Statistic Investment return rate in rental residential property in Spain 2022, by region
- Premium Statistic Investment return rate in rental residential property in Barcelona 2022, by district
- Premium Statistic Investment return rate in rental residential property in Madrid in 2022, by district
- Premium Statistic Comparison of profits from residential and tourist rentals by district of Madrid 2020
- Premium Statistic Comparison of profits from residential and tourist rentals by district Barcelona 2020
Property and tenants
5
- Premium Statistic Average days that a house is available for rent in the market in Spain 2017-2021
- Premium Statistic Rental residential property distribution by size in Spain 2020
- Premium Statistic Distribution of renter applicants in the housing market by age Spain 2022
- Premium Statistic Nationality of tenants in the housing market in Spain 2020
- Premium Statistic Annual salary of tenants in the housing market in Spain 2020
Further related statistics
14
- Average price per square meter of urban land in Aragon Q1 2016 - Q4 2020
- Average price per square meter of urban land in Valencia Q1 2016-Q4 2021
- Average price per square meter of urban land in Spain Q1 2016-Q3 2021
- Average price per square meter of urban land in the Canary Islands Q1 2016 - Q3 2020
- Average price per square meter of urban land in Catalonia Q3 2021
- Average price per square meter of urban land in Extremadura Q3 2020
- Average price per square meter of urban land in Galicia 2010-2021
- Average price per square meter of urban land in Castile and Leon Q4 2020
- Average price per square meter of urban land in Valencia 2010-2021
- Average price per square meter of urban land in Andalusia Q3 2021
- Average price per square meter of urban land in Asturias Q1 2016-Q3 2021
- Provinces with the highest square meter prices in development land Spain 2021
- More expensive streets for the price of residential square meter Spain 2016
- Industry revenue of “other activities related to real estate“ in Texas 2012-2024
Further Content: You might find this interesting as well
Statistics
- Average price per square meter of urban land in Aragon Q1 2016 - Q4 2020
- Average price per square meter of urban land in Valencia Q1 2016-Q4 2021
- Average price per square meter of urban land in Spain Q1 2016-Q3 2021
- Average price per square meter of urban land in the Canary Islands Q1 2016 - Q3 2020
- Average price per square meter of urban land in Catalonia Q3 2021
- Average price per square meter of urban land in Extremadura Q3 2020
- Average price per square meter of urban land in Galicia 2010-2021
- Average price per square meter of urban land in Castile and Leon Q4 2020
- Average price per square meter of urban land in Valencia 2010-2021
- Average price per square meter of urban land in Andalusia Q3 2021
- Average price per square meter of urban land in Asturias Q1 2016-Q3 2021
- Provinces with the highest square meter prices in development land Spain 2021
- More expensive streets for the price of residential square meter Spain 2016
- Industry revenue of “other activities related to real estate“ in Texas 2012-2024
Ministerio de Fomento (España). (December 15, 2021). Average price per square meter of urban land in the Community of Madrid from 1st quarter 2016 to 3rd quarter 2021 (in euros per square meter) [Graph]. In Statista. Retrieved June 08, 2023, from https://www.statista.com/statistics/774338/average-price-per-square-meter-of-urban-land-in-madrid/
Ministerio de Fomento (España). "Average price per square meter of urban land in the Community of Madrid from 1st quarter 2016 to 3rd quarter 2021 (in euros per square meter)." Chart. December 15, 2021. Statista. Accessed June 08, 2023. https://www.statista.com/statistics/774338/average-price-per-square-meter-of-urban-land-in-madrid/
Ministerio de Fomento (España). (2021). Average price per square meter of urban land in the Community of Madrid from 1st quarter 2016 to 3rd quarter 2021 (in euros per square meter). Statista. Statista Inc.. Accessed: June 08, 2023. https://www.statista.com/statistics/774338/average-price-per-square-meter-of-urban-land-in-madrid/
Ministerio de Fomento (España). "Average Price per Square Meter of Urban Land in The Community of Madrid from 1st Quarter 2016 to 3rd Quarter 2021 (in Euros per Square Meter)." Statista, Statista Inc., 15 Dec 2021, https://www.statista.com/statistics/774338/average-price-per-square-meter-of-urban-land-in-madrid/
Ministerio de Fomento (España), Average price per square meter of urban land in the Community of Madrid from 1st quarter 2016 to 3rd quarter 2021 (in euros per square meter) Statista, https://www.statista.com/statistics/774338/average-price-per-square-meter-of-urban-land-in-madrid/ (last visited June 08, 2023)
Average price per square meter of urban land in the Community of Madrid from 1st quarter 2016 to 3rd quarter 2021 (in euros per square meter) [Graph], Ministerio de Fomento (España), December 15, 2021. [Online]. Available: https://www.statista.com/statistics/774338/average-price-per-square-meter-of-urban-land-in-madrid/