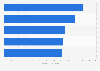
- Transportation & Logistics›
- Vehicles & Road Traffic›
Denso Corp. - total assets 2008-2019
Denso's total assets from FY 2008 to FY 2019 (in million Japanese yen)

Denso's total assets from FY 2008 to FY 2019 (in million Japanese yen)
Fiscal year | Total assets in million Japanese yen |
---|---|
2019 | 5,792,414 |
2018 | 5,764,417 |
2017 | 5,150,762 |
2016 | 5,042,896 |
2015 | 5,283,257 |
2014 | 4,642,053 |
2013 | 3,979,093 |
2012 | 3,607,697 |
2011 | 3,380,433 |
2010 | 3,364,070 |
2009 | 3,018,438 |
2008 | 3,643,418 |
Fiscal year | Total assets in million Japanese yen |
---|---|
2019 | 5,792,414 |
2018 | 5,764,417 |
2017 | 5,150,762 |
2016 | 5,042,896 |
2015 | 5,283,257 |
2014 | 4,642,053 |
2013 | 3,979,093 |
2012 | 3,607,697 |
2011 | 3,380,433 |
2010 | 3,364,070 |
2009 | 3,018,438 |
2008 | 3,643,418 |
© Statista 2019
About this statistic
Show source
Please be patient - this may take a moment
Description
Source
More information
- Show sources information
- Show publisher information
- Release date
- 2019
- Region
- Worldwide
- Survey time period
- FY 2008 to FY 2019
- Supplementary notes
-
The figures are for the fiscal years ending March 31.
One Japanese yen is approximately equal to 0.00902 U.S. dollars (as of March 31, 2019).
The figures for 2008 through 2017 were taken from previous financial statements.
Source
- Show sources information
- Show publisher information
- Release date
- 2019
More information
- Region
- Worldwide
- Survey time period
- FY 2008 to FY 2019
- Supplementary notes
-
The figures are for the fiscal years ending March 31.
One Japanese yen is approximately equal to 0.00902 U.S. dollars (as of March 31, 2019).
The figures for 2008 through 2017 were taken from previous financial statements.
Other statistics on the topic
You only have access to basic statistics.
- Instant access to 1m statistics
- Download in XLS, PDF & PNG format
- Detailed references
$59 / Month *
Corporate solution including all features.
Prices do not include sales tax.


All Information
in one Presentation
- 40 page/s
- English
- pptx
- Detailed references
Everything On "Denso" in One Document: Edited and Divided into Handy Chapters. Including Detailed References.
Statista is a great source of knowledge, and pretty helpful to manage the daily work.Christof Baron
CEO, MindShare Germany
- Company overview
- Denso's global revenue from FY 2008 to FY 2019 (in million Japanese yen)Denso - global revenue 2008-2019
- Denso's research and development expenses from FY 2008 to FY 2019 (in million Japanese yen)Denso - expenses for research and development 2008-2019
- Denso's total assets from FY 2008 to FY 2019 (in million Japanese yen)Denso Corp. - total assets 2008-2019
- Denso's worldwide number of employees from FY 2008 to FY 2019Denso - number of employees 2008-2019
- How Denso compares
- Leading motor vehicle manufacturers worldwide in 2018, based on global sales (in 1,000 units)Ranking of motor vehicle manufacturers worldwide - global sales 2018
- The leading global automotive suppliers in 2018, based on revenue (in million euros)The leading global automotive suppliers based on revenue 2018
- Brand value of the leading 40 most valuable global Japanese brands in 2019 (in million U.S. dollars)Brand value of 40 most valuable global Japanese brands 2019
- Leading domestic companies in Japan as of March 2019, by sales revenue (in trillion Japanese yen)Leading Japanese companies as of March 2019, by sales revenue
- Major competitors
- Robert Bosch GmbH's global sales of OEM automotive parts from 2001 to 2018 (in million U.S. dollars)OEM parts suppliers: Bosch's sales 2001-2018
- Distribution of Bosch's global revenue in FY 2018, by main regionBosch - revenue by region 2018
- Continental AG's revenue from FY 1999 to FY 2018 (in million euros)Continental AG's revenue 1999-2018
- Continental AG's worldwide external sales in FY 2018, by region (in million euros)Continental AG - external revenue by region 2018
- Johnson Controls International's net sales from FY 2014 to FY 2018 (in billion U.S. dollars)Johnson Controls International - net sales 2014-2018
- Johnson Controls International's revenue distribution in FY 2018, by segmentJohnson Controls - revenue distribution by business unit 2018
- Magna International's total sales between FY 2017 and FY 2018 (in million U.S. dollars)Magna: total sales 2017-2018
- Magna International's sales in FY 2018, by segment (in million U.S. dollars)Magna: sales by segment 2018
- O’Reilly Automotive - total assets 2004-2018
- Advance Auto Parts - total assets 2018
- Aisin Seiki's employee numbers FY 2009-2018
- Aisin Seiki's female employee share FY 2014-2017
- Aisin Seiki's revenue FY 2018, by product
- Aisin Seiki's female employee numbers FY 2014-2017
- Standard Motor Products - total assets 2009-2018
- Aisin Seiki's revenue FY 2018, by region
- Total assets: Federal-Mogul 2011-2016
- Aisin Seiki's revenue share FY 2018, by region
- Aisin Seiki's R&D expenses FY 2009-2018
- Aisin Seiki's revenue share FY 2018, by product
- Aisin Seiki's total assets FY 2009-2018
- Dorman's total asset 2009-2018
- Aisin Seiki's operating profit FY 2009-2018
- Carbon dioxide emissions of Nemak 2016-2018
- Auto parts companies South Korea 2018, by employment size
- Sustainability spending of Nemak 2017, by area of investment
- Nemak revenue 2018, by region
- Auto parts companies South Korea 2012-2017, by size
- OEM parts suppliers: Bosch's sales 2001-2018
- Bosch - revenue by region 2018
- Continental AG's revenue 1999-2018
- Continental AG - external revenue by region 2018
- Johnson Controls International - net sales 2014-2018
- Johnson Controls - revenue distribution by business unit 2018
- Magna: total sales 2017-2018
- Magna: sales by segment 2018
- O’Reilly Automotive - total assets 2004-2018
- Advance Auto Parts - total assets 2018
- Aisin Seiki's employee numbers FY 2009-2018
- Aisin Seiki's female employee share FY 2014-2017
- Aisin Seiki's revenue FY 2018, by product
- Aisin Seiki's female employee numbers FY 2014-2017
- Standard Motor Products - total assets 2009-2018
- Aisin Seiki's revenue FY 2018, by region
- Total assets: Federal-Mogul 2011-2016
- Aisin Seiki's revenue share FY 2018, by region
- Aisin Seiki's R&D expenses FY 2009-2018
- Aisin Seiki's revenue share FY 2018, by product
- Aisin Seiki's total assets FY 2009-2018
- Dorman's total asset 2009-2018
- Aisin Seiki's operating profit FY 2009-2018
- Carbon dioxide emissions of Nemak 2016-2018
- Auto parts companies South Korea 2018, by employment size
- Sustainability spending of Nemak 2017, by area of investment
- Nemak revenue 2018, by region
- Auto parts companies South Korea 2012-2017, by size
Statista offers dossiers and reports on over 170 industries. With Statista you are always able to make informed decisions and boost your work efficiency.
- Social Media
- E-Commerce
- Online Video & Entertainment
- Advertising & Marketing
- Alcoholic Beverages
- Cleaning Products
- Cosmetics & Personal Care
- Food & Nutrition
- Health & Hygiene
- International Trade
- Shopping Behavior
- Sports & Leisure
- Business Travel
- Leisure Travel
- Accomodation
- Restaurants
- Demographics
- Economy
- Education & Science
- Politics & Government
- Aviation
- Rail Transport
- Vehicles & Road Traffic
- Water Transport
Register in seconds and access exclusive features.
Basic Account
|
Instant Access
Premium Account
| ||
---|---|---|---|
Our services
Click the question mark for further information | Free |
$59 per month*
| |
Basic statistics | |||
Premium statistics | |||
Graph download
| |||
Download PDF | |||
Excel download
| |||
Register | Purchase now |
This feature is limited to our corporate solutions.
Please contact us to get started with full access to dossiers, forecasts, studies and international data.
We use cookies to personalize contents and ads, offer social media features, and analyze access to our website. In your browser settings you can configure or disable this, respectively, and can delete any already placed cookies. For details, please see your browser’s Help section (by pressing F1). Please see our privacy statement for details about how we use data.