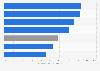
The average annual air pollution level of PM2.5 in Lahore was over 97 µg/m³ in 2022, the highest among megacities in the Asia-Pacific region. In comparison, Tokyo's average annual air pollution level of PM2.5 was 9.2 µg/m³ in 2022, just slightly exceeding the World Health Organization guideline target of maximum five µg/m³.
Annual average air pollution level of particulate matter (PM2.5 ) in selected megacities in the Asia-Pacific region in 2022 (in micrograms per cubic meter)
Basic Account
Get to know the platform
You only have access to basic statistics.
This statistic is not included in your account.
Starter Account
The ideal entry-level account for individual users
- Instant access to 1m statistics
- Download in XLS, PDF & PNG format
- Detailed references
$189 USD $149 USD / Month *
in the first 12 months
Professional Account
Full access
Business Solutions including all features.
* Prices do not include sales tax.
Other statistics that may interest you Megacities in the Asia-Pacific region
Overview
6
- Premium Statistic Distribution of urban areas globally 2023, by continent
- Premium Statistic Largest megacities worldwide 2023, by land area
- Premium Statistic Cities with the highest population density globally 2022
- Premium Statistic Population of megacities APAC 2023
- Premium Statistic Annual population growth rate of megacities APAC 2023
- Premium Statistic Population of the largest non-megacities APAC 2023
Urban population
4
Economy and affordability
4
Housing
3
Pollution and traffic
4
- Premium Statistic Pollution index score of megacities APAC 2023, by city
- Premium Statistic Annual average air pollution level of PM2.5 in megacities APAC 2022
- Premium Statistic Traffic congestion in selected megacities APAC 2021, by city
- Premium Statistic Annual time in rush hours in megacities Asia 2022
Further related statistics
18
- Air pollution level of PM2.5 New Zealand 2015 by source
- Air pollution level of PM2.5 from energy activities New Zealand 2015 by source
- Population weighted PM air pollution exposure Laos 1990-2019
- Average annual PM 2.5 concentration in selected Italian cities 2021
- Population weighted PM air pollution exposure Cambodia 1990-2019
- Population weighted PM air pollution exposure in Indonesia 1990-2019
- Population weighted PM air pollution exposure Philippines 1990-2019
- Population weighted PM air pollution exposure in Thailand 1990-2019
- Population weighted PM air pollution exposure Myanmar 1990-2019
- Exposure to PM2.5 concentration in Poland 1990-2019
- PM2.5 concentration in Poland 2019-2020, by region
- Annual air pollution level of PM10 in Singapore 2013-2022
- Annual air pollution level of PM10 in selected cities Australia 2016
- Maximum 99 percentile 24 hours air pollution level of PM10 in Singapore 2013-2022
- Annual air pollution level of PM2.5 in selected cities Australia 2016
- Pollutants emitted by fishing vessels in China 2019, by type
- Concentration of PM 2.5 in Noida India 2017-2019
- DALYs number due to PM2.5 pollution in India 1990-2019
Further Content: You might find this interesting as well
Statistics
- Air pollution level of PM2.5 New Zealand 2015 by source
- Air pollution level of PM2.5 from energy activities New Zealand 2015 by source
- Population weighted PM air pollution exposure Laos 1990-2019
- Average annual PM 2.5 concentration in selected Italian cities 2021
- Population weighted PM air pollution exposure Cambodia 1990-2019
- Population weighted PM air pollution exposure in Indonesia 1990-2019
- Population weighted PM air pollution exposure Philippines 1990-2019
- Population weighted PM air pollution exposure in Thailand 1990-2019
- Population weighted PM air pollution exposure Myanmar 1990-2019
- Exposure to PM2.5 concentration in Poland 1990-2019
- PM2.5 concentration in Poland 2019-2020, by region
- Annual air pollution level of PM10 in Singapore 2013-2022
- Annual air pollution level of PM10 in selected cities Australia 2016
- Maximum 99 percentile 24 hours air pollution level of PM10 in Singapore 2013-2022
- Annual air pollution level of PM2.5 in selected cities Australia 2016
- Pollutants emitted by fishing vessels in China 2019, by type
- Concentration of PM 2.5 in Noida India 2017-2019
- DALYs number due to PM2.5 pollution in India 1990-2019
IQAir. (April 20, 2023). Annual average air pollution level of particulate matter (PM2.5 ) in selected megacities in the Asia-Pacific region in 2022 (in micrograms per cubic meter) [Graph]. In Statista. Retrieved September 29, 2023, from https://www.statista.com/statistics/911844/asia-pacific-annual-air-pollution-level-pm25/
IQAir. "Annual average air pollution level of particulate matter (PM2.5 ) in selected megacities in the Asia-Pacific region in 2022 (in micrograms per cubic meter)." Chart. April 20, 2023. Statista. Accessed September 29, 2023. https://www.statista.com/statistics/911844/asia-pacific-annual-air-pollution-level-pm25/
IQAir. (2023). Annual average air pollution level of particulate matter (PM2.5 ) in selected megacities in the Asia-Pacific region in 2022 (in micrograms per cubic meter). Statista. Statista Inc.. Accessed: September 29, 2023. https://www.statista.com/statistics/911844/asia-pacific-annual-air-pollution-level-pm25/
IQAir. "Annual Average Air Pollution Level of Particulate Matter (Pm2.5 ) in Selected Megacities in The Asia-pacific Region in 2022 (in Micrograms per Cubic Meter)." Statista, Statista Inc., 20 Apr 2023, https://www.statista.com/statistics/911844/asia-pacific-annual-air-pollution-level-pm25/
IQAir, Annual average air pollution level of particulate matter (PM2.5 ) in selected megacities in the Asia-Pacific region in 2022 (in micrograms per cubic meter) Statista, https://www.statista.com/statistics/911844/asia-pacific-annual-air-pollution-level-pm25/ (last visited September 29, 2023)
Annual average air pollution level of particulate matter (PM2.5 ) in selected megacities in the Asia-Pacific region in 2022 (in micrograms per cubic meter) [Graph], IQAir, April 20, 2023. [Online]. Available: https://www.statista.com/statistics/911844/asia-pacific-annual-air-pollution-level-pm25/