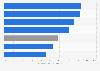
Traffic congestion in selected megacities APAC 2021, by city

Traffic congestion level in selected megacities in Asia Pacific in 2021, by city

Download
Show detailed source information?
Register for free
Already a member?
Log in
Source

Use Ask Statista Research Service

Release date

February 2022

Region

APAC

Survey time period

2021

Supplementary notes

According to the source, the index is a congestion level and measures the increase in overall travel times when compared to a Free Flow situation. For example, a Congestion Level of 36 percent corresponds to 36 percent extra travel time for any trip, anywhere in the city, at any time compared to what it would be in a Free Flow situation.

Citation formats
Statista Accounts: Access All Statistics. Starting from $2,388 USD / Year
Basic Account
Get to know the platform

You only have access to basic statistics.
This statistic is not included in your account.

Starter Account
The ideal entry-level account for individual users
  • Instant access to 1m statistics
  • Download in XLS, PDF & PNG format
  • Detailed references
$199 USD / Month *
Professional Account
Full access

Business Solutions including all features.

* Prices do not include sales tax.

Other statistics that may interest you Megacities in the Asia-Pacific region

Overview

6

Urban population

4

Economy and affordability

4

Housing

3

Pollution and traffic

4

Further related statistics

15
Statista Accounts: Access All Statistics. Starting from $2,388 USD / Year
Learn more about how Statista can support your business.