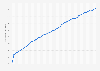
This statistic shows the average disposable income of German households in 2017, by household type. Households with only one person had the lowest average disposable income at 20,461 euros. Households consisting of three or more adults with kid(s) had the greatest disposable income on average, approximately 66,000 euros.
Average annual disposable income in Germany in 2017, by household type (in euros)
Basic Account
Get to know the platform
You only have access to basic statistics.
This statistic is not included in your account.
Starter Account
The ideal entry-level account for individual users
- Instant access to 1m statistics
- Download in XLS, PDF & PNG format
- Detailed references
$59 USD $39 USD / Month *
in the first 12 months
Professional Account
Full access
Business Solutions including all features.
* Prices do not include sales tax.
Statistics on Demographics of the U.S. Part II
Households
8
- Basic Statistic Number of U.S. households, by type 2021
- Basic Statistic Percentage of U.S. households, by type 1990-2022
- Basic Statistic Number of households in the U.S. 1960-2022
- Basic Statistic Average size of households in the U.S. 1960-2022
- Basic Statistic Number of U.S. households 2021, by state
- Basic Statistic Average size of U.S. households 2021, by state
- Basic Statistic Number of households in the U.S. by size of household 1970-2022
- Basic Statistic Distribution of households in the U.S. 1970-2021, by household size
Families
7
- Basic Statistic Number of families in the U.S. 1960-2022
- Basic Statistic Average size of U.S. families 2021, by state
- Basic Statistic U.S. families income distribution 2021, by race and origin
- Basic Statistic U.S. number of families with a single father 1990-2021
- Basic Statistic Number of families with a single mother U.S. 1990-2021
- Basic Statistic U.S. family households with children, by family type 1970-2021
- Premium Statistic Number of families in the US by number of children 2000-2022
Marriage and divorce
8
- Basic Statistic Marital status of the U.S. population 2021, by sex
- Premium Statistic Number of marriages in the U.S. 1990-2020
- Premium Statistic Number of divorces in the U.S. 1981-2020
- Premium Statistic USA - Marriage rate 1990-2021
- Premium Statistic U.S. - divorce rate 1990-2021
- Premium Statistic Marriage rates in the U.S. 2021, by state
- Premium Statistic U.S. - divorce rate 2020, by state
- Basic Statistic Number of married couples U.S. 2022, by race and Hispanic origin
Further related statistics
13
- Italy: percentage change in median disposable household income 1991-2010
- Household situation among charity givers Australia 2019
- Italy: households' financial asset distribution 2016, by type
- Annual household disposable income in France 1996-2019
- Public survey on financial hardship frequency in Russia 2020, by family type
- U.S. per capita disposable personal income 2021, by state
- Netherlands: average disposable income per private household 2021, by household type
- Per capita disposable personal income in Colorado 1990-2021
- Per capita disposable personal income in Kentucky 1990-2019
- Per capita disposable personal income in Missouri 1990-2019
- Per capita disposable personal income in Oregon 1990-2021
- Per capita disposable personal income in Wisconsin 1990-2021
- Most important motives not to waste food in the Netherlands 2016
Further Content: You might find this interesting as well
Statistics
- Italy: percentage change in median disposable household income 1991-2010
- Household situation among charity givers Australia 2019
- Italy: households' financial asset distribution 2016, by type
- Annual household disposable income in France 1996-2019
- Public survey on financial hardship frequency in Russia 2020, by family type
- U.S. per capita disposable personal income 2021, by state
- Netherlands: average disposable income per private household 2021, by household type
- Per capita disposable personal income in Colorado 1990-2021
- Per capita disposable personal income in Kentucky 1990-2019
- Per capita disposable personal income in Missouri 1990-2019
- Per capita disposable personal income in Oregon 1990-2021
- Per capita disposable personal income in Wisconsin 1990-2021
- Most important motives not to waste food in the Netherlands 2016
Statistisches Bundesamt. (May 1, 2020). Average annual disposable income in Germany in 2017, by household type (in euros) [Graph]. In Statista. Retrieved March 27, 2023, from https://www.statista.com/statistics/999433/average-disposable-income-household-type-germany/
Statistisches Bundesamt. "Average annual disposable income in Germany in 2017, by household type (in euros)." Chart. May 1, 2020. Statista. Accessed March 27, 2023. https://www.statista.com/statistics/999433/average-disposable-income-household-type-germany/
Statistisches Bundesamt. (2020). Average annual disposable income in Germany in 2017, by household type (in euros). Statista. Statista Inc.. Accessed: March 27, 2023. https://www.statista.com/statistics/999433/average-disposable-income-household-type-germany/
Statistisches Bundesamt. "Average Annual Disposable Income in Germany in 2017, by Household Type (in Euros)." Statista, Statista Inc., 1 May 2020, https://www.statista.com/statistics/999433/average-disposable-income-household-type-germany/
Statistisches Bundesamt, Average annual disposable income in Germany in 2017, by household type (in euros) Statista, https://www.statista.com/statistics/999433/average-disposable-income-household-type-germany/ (last visited March 27, 2023)
Average annual disposable income in Germany in 2017, by household type (in euros) [Graph], Statistisches Bundesamt, May 1, 2020. [Online]. Available: https://www.statista.com/statistics/999433/average-disposable-income-household-type-germany/