Lenovo’s business segments
Lenovo’s business is organized into three segments. The first, the Intelligent Devices Group (IDG), is made up of the Personal Computer and Smart Devices Business Group (PCSD), including PCs, tablets, augmented and virtual reality (AR/VR), and smart devices, and the Mobile Business Group (MBG) for smartphones. The second segment, the Data Center Business Group (DCG), includes servers, storage, networking, software, and services, while the third and final segment, the Lenovo Capital and Incubator Group (LCIG), helps to drive innovation through startup investments.Lenovo’s competitors
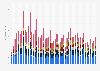
Lenovo ranks highly among vendors in the global PC market, consistently ahead of other notable companies such HP and Dell, as well being one of the leading Chromebook vendors too. The company also offers a range of smartphone devices too under the Motorola branding following the acquisition of the company in 2014. However, Lenovo’s smartphone market share has declined over the years, with the company now putting more of an emphasis on its growing data center segment, including the company’s hybrid cloud, edge computing, and software-defined storage solutions. In addition to this, Lenovo is also regarded as one of the leading supercomputer providers globally.