Chemical industry M&A worldwide - statistics & facts
Merger and acquisition (M&A) activity in the global chemicals industry is usually high. However, recent years have seen a notable decline in the number of M&A transactions. In 2023, there were 971 announced deals, down from 977 the previous year. This continues a downward trend from 2021, which saw 1,251 M&A deals. Throughout this period the industry has faced challenges such as elevated interest rates, restrictive credit markets, and dampened revenue and earnings performance, impacting M&A activity. Despite this, chemical executives remain optimistic, with 86 percent of respondents in a recent survey of chemical industry executives expressing a likelihood of undertaking M&A in 2024.
Though the terms "merger" and "acquisition" are often used interchangeably, they describe different processes of company consolidation. A merger involves the combining of two companies to create a new entity, while an acquisition, sometimes called a hostile takeover, involves one company purchasing another. In 2022, the total global value of M&A activity across all sectors was approximately 3.4 trillion U.S. dollars. Specifically, in the chemical industry, the total value of M&A activity was 68 billion U.S. dollars that year. By 2023, this value rose to 101 billion U.S. dollars, marking a 49 percent increase from the previous year's total.
Although in recent years, the overall volume of M&A within the global chemicals sector has witnessed a decline, the total value of transactions experienced a notable increase in 2023. M&A remains an important strategic maneuver for chemical companies, as the industry sustains a relatively high level of activity driven by persistent demands for growth, innovation, and competitive positioning.
Though the terms "merger" and "acquisition" are often used interchangeably, they describe different processes of company consolidation. A merger involves the combining of two companies to create a new entity, while an acquisition, sometimes called a hostile takeover, involves one company purchasing another. In 2022, the total global value of M&A activity across all sectors was approximately 3.4 trillion U.S. dollars. Specifically, in the chemical industry, the total value of M&A activity was 68 billion U.S. dollars that year. By 2023, this value rose to 101 billion U.S. dollars, marking a 49 percent increase from the previous year's total.
Chemical M&A: which chemical subsectors and regions are the most active?
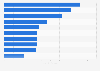
In 2023, commodity chemicals led the chemical subsectors in M&A deal volume, with 282 deals globally. This was roughly double the number of deals in specialty chemicals, which had 127, making it the second-largest subsector. Regionally, the United States had the highest number of chemical industry deals, totaling 140. China followed with the second-largest volume of chemical M&A deals, amounting to 43.Which are the main chemical companies involved in M&A activity?
Several high-profile chemical M&A deals have been completed in recent years, such as Bayer’s acquisition of Monsanto (completed in 2018), and the merger of Dow and DuPont (completed in 2017). Since the DowDuPont merger the conglomerate has split into three companies: Dow, DuPont, and agricultural chemical newcomer, Corteva. The most valuable completed deal in the industry was Celanese Corp's acquisition of DuPont de Nemours's Mobility Division, which was valued at 11 billion U.S. dollars.Although in recent years, the overall volume of M&A within the global chemicals sector has witnessed a decline, the total value of transactions experienced a notable increase in 2023. M&A remains an important strategic maneuver for chemical companies, as the industry sustains a relatively high level of activity driven by persistent demands for growth, innovation, and competitive positioning.