ABRAMS world trade wiki, in June 2018, Finland exported non-packaged medicaments valued at approximately 43 thousand U.S. dollars.
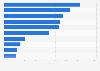
This statistic shows the export value of medicaments, not packaged for retail sale (HS Code 3003), from Finland from December 2017 to December 2018. According to data provided by Monthly value of medicaments (not packaged for retail sale) exported from Finland from December 2017 to December 2018 (in 1,000 U.S. dollars)
Basic Account
Get to know the platform
You only have access to basic statistics.
This statistic is not included in your account.
Starter Account
The ideal entry-level account for individual users
- Instant access to 1m statistics
- Download in XLS, PDF & PNG format
- Detailed references
$59 USD $39 USD / Month *
in the first 12 months
Professional Account
Full access
Business Solutions including all features.
* Prices do not include sales tax.
Statistics on Top pharmaceutical drugs
Global overview
4
- Premium Statistic Pharmaceutical market: worldwide revenue 2001-2022
- Premium Statistic Drugs generating 10 billion U.S. dollars or more in annual sales worldwide 2021
- Basic Statistic Top global biopharma drugs by lifetime sales up to 2026
- Premium Statistic Top 50 pharmaceutical companies - Rx sales and R&D spending 2021
Top companies' top products
5
- Premium Statistic Pfizer's top products based on revenue 2022
- Premium Statistic AbbVie's key product revenues 2021-2022
- Premium Statistic Novartis' top drugs based on revenue 2022
- Premium Statistic Sales of Johnson & Johnson's pharmaceutical products 2020-2022
- Premium Statistic Pharmaceutical company Roche: top drugs based on revenue 2021-2022
Best-selling drugs
8
- Basic Statistic Top pharmaceutical products by sales worldwide 2022
- Premium Statistic Revenue of AbbVie's Humira 2011-2022
- Premium Statistic Merck & Co.'s Keytruda revenue 2014-2022
- Premium Statistic Celgene's top product revenues 2008-2021
- Premium Statistic Price increase of top selling drugs U.S. 2016-2021
- Basic Statistic U.S. prices of Revlimid compared to prices in select countries 2020
- Basic Statistic Number of patent applications filed for top U.S. drugs 2022
- Premium Statistic Number of patents granted for the top selling U.S. drugs 2022
U.S. overview
4
Outlook
5
- Premium Statistic Leading global pharmaceutical products by projected sales 2026
- Basic Statistic Leading U.S. pharmaceutical products by revenue 2026
- Premium Statistic Expiring patents for blockbuster and other small-molecule drugs worldwide 2020-2026
- Basic Statistic Top therapeutic categories worldwide 2022, by number of R&D products
- Basic Statistic Projected most valuable R&D projects based on net present value 2022
Further related statistics
20
- Monthly value of medicament exports from Norway 2017-2018
- Monthly value of medicament exports from Sweden 2017-2018
- Monthly value of medicament exports from Norway 2017-2018
- Monthly value of medicament exports from Sweden 2017-2018
- Monthly value of medicament exports from Denmark 2018
- Monthly value of medicament exports from Iceland 2017-2018
- Monthly value of medicament exports from Finland 2018
- Monthly value of medicament imports into Norway 2017-2018
- Monthly value of medicament imports into Sweden 2017-2018
- Monthly value of medicament imports into Iceland 2018
- Monthly value of medicament imports into Denmark 2018
- Monthly value of medicament imports into Finland 2018
- Monthly value of medicament imports into Iceland 2018
- Monthly value of medicament imports into Finland 2018
- Monthly value of medicament imports into Denmark 2018
- U.S. hospitals with select levels of medication price markups 2017
- Europe: forecast of top selling pharmaceuticals in 2022, by trade name
- Market sales of non-prescription medicine in Europe 2017, by country
- Most abused prescription drugs by dispensed prescriptions U.S. 2013
Further Content: You might find this interesting as well
Statistics
- Monthly value of medicament exports from Norway 2017-2018
- Monthly value of medicament exports from Sweden 2017-2018
- Monthly value of medicament exports from Norway 2017-2018
- Monthly value of medicament exports from Sweden 2017-2018
- Monthly value of medicament exports from Denmark 2018
- Monthly value of medicament exports from Iceland 2017-2018
- Monthly value of medicament exports from Finland 2018
- Monthly value of medicament imports into Norway 2017-2018
- Monthly value of medicament imports into Sweden 2017-2018
- Monthly value of medicament imports into Iceland 2018
- Monthly value of medicament imports into Denmark 2018
- Monthly value of medicament imports into Finland 2018
- Monthly value of medicament imports into Iceland 2018
- Monthly value of medicament imports into Finland 2018
- Monthly value of medicament imports into Denmark 2018
- U.S. hospitals with select levels of medication price markups 2017
- Europe: forecast of top selling pharmaceuticals in 2022, by trade name
- Market sales of non-prescription medicine in Europe 2017, by country
- Most abused prescription drugs by dispensed prescriptions U.S. 2013
ABRAMS world trade wiki. (May 22, 2019). Monthly value of medicaments (not packaged for retail sale) exported from Finland from December 2017 to December 2018 (in 1,000 U.S. dollars) [Graph]. In Statista. Retrieved March 20, 2023, from https://www.statista.com/statistics/1020787/monthly-value-of-non-packaged-medicament-exports-from-finland/
ABRAMS world trade wiki. "Monthly value of medicaments (not packaged for retail sale) exported from Finland from December 2017 to December 2018 (in 1,000 U.S. dollars)." Chart. May 22, 2019. Statista. Accessed March 20, 2023. https://www.statista.com/statistics/1020787/monthly-value-of-non-packaged-medicament-exports-from-finland/
ABRAMS world trade wiki. (2019). Monthly value of medicaments (not packaged for retail sale) exported from Finland from December 2017 to December 2018 (in 1,000 U.S. dollars). Statista. Statista Inc.. Accessed: March 20, 2023. https://www.statista.com/statistics/1020787/monthly-value-of-non-packaged-medicament-exports-from-finland/
ABRAMS world trade wiki. "Monthly Value of Medicaments (Not Packaged for Retail Sale) Exported from Finland from December 2017 to December 2018 (in 1,000 U.S. Dollars)." Statista, Statista Inc., 22 May 2019, https://www.statista.com/statistics/1020787/monthly-value-of-non-packaged-medicament-exports-from-finland/
ABRAMS world trade wiki, Monthly value of medicaments (not packaged for retail sale) exported from Finland from December 2017 to December 2018 (in 1,000 U.S. dollars) Statista, https://www.statista.com/statistics/1020787/monthly-value-of-non-packaged-medicament-exports-from-finland/ (last visited March 20, 2023)
Monthly value of medicaments (not packaged for retail sale) exported from Finland from December 2017 to December 2018 (in 1,000 U.S. dollars) [Graph], ABRAMS world trade wiki, May 22, 2019. [Online]. Available: https://www.statista.com/statistics/1020787/monthly-value-of-non-packaged-medicament-exports-from-finland/