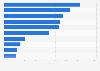
Johnson and Johnson is a leading international pharmaceutical company. In 2023, among its top pharmaceutical products was Darzalex which earned some 9.7 billion U.S. dollars of revenue. Darzalex is a drug used in the treatment of of multiple myeloma and light chain amyloidosis. The highest revenue generating drug is tsill Stelara which generated almost 11 billion U.S. dollars of revenue for the company.
International pharmaceutical companies
There are several major pharmaceutical companies that are making significant economic impacts globally. In 2022, Pfizer, AbbVie, and Johnson & Johnson were the top pharmaceutical companies based on their prescription drug sales globally. When viewed by market capitalization, Johnson and Johnson was the second ranked global pharmaceutical company, as of 2023.
Top pharmaceuticals
The global pharmaceutical industry showed significant growth of revenues over the past two decades. Globally, oncology, diabetes and immunology are considered the top therapeutic areas for future growth. In 2022, when covid vaccines are excluded, Humira by AbbVie, Keytruda by Merck & Co. and Paxlovid by Pfizer were the top drugs based on sales worldwide.
Sales of Johnson & Johnson's top pharmaceutical products from 2021 to 2023
(in million U.S. dollars)
Profit from the additional features of your individual account
Currently, you are using a shared account. To use individual functions (e.g., mark statistics as favourites, set
statistic alerts) please log in with your personal account.
If you are an admin, please authenticate by logging in again.
Learn more about how Statista can support your business.
Johnson & Johnson. (February 16, 2024). Sales of Johnson & Johnson's top pharmaceutical products from 2021 to 2023 (in million U.S. dollars) [Graph]. In Statista. Retrieved September 19, 2024, from https://www.statista.com/statistics/266405/global-revenue-of-johnson-und-johnsons-pharmaceutical-segment-by-product/
Johnson & Johnson. "Sales of Johnson & Johnson's top pharmaceutical products from 2021 to 2023 (in million U.S. dollars)." Chart. February 16, 2024. Statista. Accessed September 19, 2024. https://www.statista.com/statistics/266405/global-revenue-of-johnson-und-johnsons-pharmaceutical-segment-by-product/
Johnson & Johnson. (2024). Sales of Johnson & Johnson's top pharmaceutical products from 2021 to 2023 (in million U.S. dollars). Statista. Statista Inc.. Accessed: September 19, 2024. https://www.statista.com/statistics/266405/global-revenue-of-johnson-und-johnsons-pharmaceutical-segment-by-product/
Johnson & Johnson. "Sales of Johnson & Johnson's Top Pharmaceutical Products from 2021 to 2023 (in Million U.S. Dollars)." Statista, Statista Inc., 16 Feb 2024, https://www.statista.com/statistics/266405/global-revenue-of-johnson-und-johnsons-pharmaceutical-segment-by-product/
Johnson & Johnson, Sales of Johnson & Johnson's top pharmaceutical products from 2021 to 2023 (in million U.S. dollars) Statista, https://www.statista.com/statistics/266405/global-revenue-of-johnson-und-johnsons-pharmaceutical-segment-by-product/ (last visited September 19, 2024)
Sales of Johnson & Johnson's top pharmaceutical products from 2021 to 2023 (in million U.S. dollars) [Graph], Johnson & Johnson, February 16, 2024. [Online]. Available: https://www.statista.com/statistics/266405/global-revenue-of-johnson-und-johnsons-pharmaceutical-segment-by-product/