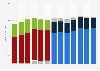
The statistic depicts the weighted average of local telecom in local markets in the U.S. in 2011, by service provider. LEC incumbent providers held a market share of 60.7 percent of the local U.S. telecom market in 2011.
Weighted average of local telecom in local markets in the U.S. in 2011, by service provider
Methodology: This table was created by taking the weighted averages of the platform-based concentration in a local market outside of AT&T and Verizon Wireline territory; provider concentration in an AT&T landline local franchise market; and the provider concentration in a Verizon landline local franchise market. Breakdown of mobile vs. landline (including business lines) percentages are based on 2009 average minutes per month. Earlier years extrapolated based on 2009 figure. Distribution among cable firms is based on telephone revenue. Assumed one landline incumbent available to a local subscriber.
Profit from the additional features of your individual account
Currently, you are using a shared account. To use individual functions (e.g., mark statistics as favourites, set
statistic alerts) please log in with your personal account.
If you are an admin, please authenticate by logging in again.
Learn more about how Statista can support your business.
Columbia Institute for Tele-Information. (August 31, 2011). Weighted average of local telecom in local markets in the U.S. in 2011, by service provider [Graph]. In Statista. Retrieved July 27, 2024, from https://www.statista.com/statistics/214206/us-local-telecom-market-share-by-provider/
Columbia Institute for Tele-Information. "Weighted average of local telecom in local markets in the U.S. in 2011, by service provider." Chart. August 31, 2011. Statista. Accessed July 27, 2024. https://www.statista.com/statistics/214206/us-local-telecom-market-share-by-provider/
Columbia Institute for Tele-Information. (2011). Weighted average of local telecom in local markets in the U.S. in 2011, by service provider. Statista. Statista Inc.. Accessed: July 27, 2024. https://www.statista.com/statistics/214206/us-local-telecom-market-share-by-provider/
Columbia Institute for Tele-Information. "Weighted Average of Local Telecom in Local Markets in The U.S. in 2011, by Service Provider." Statista, Statista Inc., 31 Aug 2011, https://www.statista.com/statistics/214206/us-local-telecom-market-share-by-provider/
Columbia Institute for Tele-Information, Weighted average of local telecom in local markets in the U.S. in 2011, by service provider Statista, https://www.statista.com/statistics/214206/us-local-telecom-market-share-by-provider/ (last visited July 27, 2024)
Weighted average of local telecom in local markets in the U.S. in 2011, by service provider [Graph], Columbia Institute for Tele-Information, August 31, 2011. [Online]. Available: https://www.statista.com/statistics/214206/us-local-telecom-market-share-by-provider/