This statistic shows the research and development (R&D) expenditure of Monsanto from 2008 to 2017. In 2017, the company invested approximately 1.61 billion U.S. dollars in research and development. Monsanto was an agricultural company specialized on genetically engineered seeds. The company was headquartered in St Louis, Missouri. In September 2016, Bayer finalized a deal to take Monsanto over, which was completed on June 7, 2018.
Monsanto's research and development (R&D) expenditure from 2008 to 2017 (in million U.S. dollars)*
Loading statistic...
Basic Account
Get to know the platform
You only have access to basic statistics.
Starter Account
The ideal entry-level account for individual users
- Instant access to 1m statistics
- Download in XLS, PDF & PNG format
- Detailed references
$149 USD / Month *
Professional Account
Full access
Business Solutions including all features.
* Prices do not include sales tax.
Other statistics that may interest you Monsanto
Agribusiness overview
3
Crop protection overview
3
Industry standing
5
- Premium Statistic Leading seed and pesticide companies worldwide 2016, based on revenue
- Premium Statistic Global herbicide market share 2016, by company
- Premium Statistic Bayer and Monsanto merger - selected data 2016
- Premium Statistic Bayer's acquisition offers to Monsanto May-September 2016
- Premium Statistic Top ten U.S. patent litigation cases by damages awarded 1997-2017
Company overview
8
- Premium Statistic Monsanto's net sales 2008-2017
- Basic Statistic Monsanto's seed and genomics segment net sales 2011-2017
- Basic Statistic Monsanto's net sales in the agricultural productivity segment 2011-2017
- Premium Statistic Monsanto's net income 2011-2017
- Premium Statistic EBIT of Monsanto 2011-2017
- Basic Statistic 
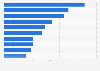
Monsanto's R&D expenditure 2008-2017
- Basic Statistic Monsanto's total assets 2008-2017
- Basic Statistic Monsanto's number of regular and temporary workers worldwide 2013-2017
Further related statistics
18
- Monsanto's waste generation 2017
- Monsanto's direct and indirect energy consumption 2015-2017
- Monsanto's electricity generation fuel mix 2015-2017
- Monsanto's GHG emissions 2015-2017
- Freshwater withdrawals by Monsanto 2015-2017
- Monsanto's waste generation by disposal method 2017
- Market share of global LED grow lights in research applications by region 2016 & 2021
- Business-funded research - share of GDP for selected countries
- Change in business-funded research for selected countries worldwide
- Government-funded research - percentage change for selected countries
- UK government expenditure on research and development 1990-2018
- Claas - costs of research and development 2005-2022
- Industry revenue of “research, experimental development on biotechnology“ in Germany 2012-2025
- Industry revenue of “research, experimental development on biotechnology“ in Sweden 2012-2025
- Smartphone travel bookers in the United States 2012-2018
- Industry revenue of “research on social sciences and humanities“ in the United Kingdom 2012-2025
- U.S. states with large employment in research, testing, and medical laboratories 2021
- Industry revenue of “Market research and public opinion polling“ in South Korea 2012-2024
Further Content: You might find this interesting as well
Statistics
- Monsanto's waste generation 2017
- Monsanto's direct and indirect energy consumption 2015-2017
- Monsanto's electricity generation fuel mix 2015-2017
- Monsanto's GHG emissions 2015-2017
- Freshwater withdrawals by Monsanto 2015-2017
- Monsanto's waste generation by disposal method 2017
- Market share of global LED grow lights in research applications by region 2016 & 2021
- Business-funded research - share of GDP for selected countries
- Change in business-funded research for selected countries worldwide
- Government-funded research - percentage change for selected countries
- UK government expenditure on research and development 1990-2018
- Claas - costs of research and development 2005-2022
- Industry revenue of “research, experimental development on biotechnology“ in Germany 2012-...
- Industry revenue of “research, experimental development on biotechnology“ in Sweden 2012-2...
- Smartphone travel bookers in the United States 2012-2018
- Industry revenue of “research on social sciences and humanities“ in the United Kingdom 201...
- U.S. states with large employment in research, testing, and medical laboratories 2021
- Industry revenue of “Market research and public opinion polling“ in South Korea 2012-2024
Monsanto. (October 27, 2017). Monsanto's research and development (R&D) expenditure from 2008 to 2017 (in million U.S. dollars)* [Graph]. In Statista. Retrieved December 07, 2023, from https://www.statista.com/statistics/273312/monsanto-research-and-development-expenditure-since-2008/
Monsanto. "Monsanto's research and development (R&D) expenditure from 2008 to 2017 (in million U.S. dollars)*." Chart. October 27, 2017. Statista. Accessed December 07, 2023. https://www.statista.com/statistics/273312/monsanto-research-and-development-expenditure-since-2008/
Monsanto. (2017). Monsanto's research and development (R&D) expenditure from 2008 to 2017 (in million U.S. dollars)*. Statista. Statista Inc.. Accessed: December 07, 2023. https://www.statista.com/statistics/273312/monsanto-research-and-development-expenditure-since-2008/
Monsanto. "Monsanto's Research and Development (R&d) Expenditure from 2008 to 2017 (in Million U.S. Dollars)*." Statista, Statista Inc., 27 Oct 2017, https://www.statista.com/statistics/273312/monsanto-research-and-development-expenditure-since-2008/
Monsanto, Monsanto's research and development (R&D) expenditure from 2008 to 2017 (in million U.S. dollars)* Statista, https://www.statista.com/statistics/273312/monsanto-research-and-development-expenditure-since-2008/ (last visited December 07, 2023)
Monsanto's research and development (R&D) expenditure from 2008 to 2017 (in million U.S. dollars)* [Graph], Monsanto, October 27, 2017. [Online]. Available: https://www.statista.com/statistics/273312/monsanto-research-and-development-expenditure-since-2008/