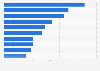
This statistic displays Monsanto's net sales from 2008 to 2017. In 2017, Monsanto reported net sales of approximately 14.6 billion U.S. dollars. Monsanto was an agricultural company specialized on genetically engineered seeds. The company was headquartered in St Louis, Missouri. In September 2016, Bayer finalized a deal to take Monsanto over, which was completed on June 7, 2018.
Monsanto's net sales from 2008 to 2017 (in million U.S. dollars)*
Characteristic
Net sales in million U.S. dollars
-
-
-
-
-
-
-
-
-
-
-
-
-
-
-
-
-
-
-
-
Exclusive Premium Statistic
To access all Premium Statistics, you need a paid Statista Account
Profit from the additional features of your individual account
Currently, you are using a shared account. To use individual functions (e.g., mark statistics as favourites, set
statistic alerts) please log in with your personal account.
If you are an admin, please authenticate by logging in again.
Learn more about how Statista can support your business.
Monsanto. (October 27, 2017). Monsanto's net sales from 2008 to 2017 (in million U.S. dollars)* [Graph]. In Statista. Retrieved July 27, 2024, from https://www.statista.com/statistics/276270/net-sales-and-net-income-of-monsanto-since-2008/
Monsanto. "Monsanto's net sales from 2008 to 2017 (in million U.S. dollars)*." Chart. October 27, 2017. Statista. Accessed July 27, 2024. https://www.statista.com/statistics/276270/net-sales-and-net-income-of-monsanto-since-2008/
Monsanto. (2017). Monsanto's net sales from 2008 to 2017 (in million U.S. dollars)*. Statista. Statista Inc.. Accessed: July 27, 2024. https://www.statista.com/statistics/276270/net-sales-and-net-income-of-monsanto-since-2008/
Monsanto. "Monsanto's Net Sales from 2008 to 2017 (in Million U.S. Dollars)*." Statista, Statista Inc., 27 Oct 2017, https://www.statista.com/statistics/276270/net-sales-and-net-income-of-monsanto-since-2008/
Monsanto, Monsanto's net sales from 2008 to 2017 (in million U.S. dollars)* Statista, https://www.statista.com/statistics/276270/net-sales-and-net-income-of-monsanto-since-2008/ (last visited July 27, 2024)
Monsanto's net sales from 2008 to 2017 (in million U.S. dollars)* [Graph], Monsanto, October 27, 2017. [Online]. Available: https://www.statista.com/statistics/276270/net-sales-and-net-income-of-monsanto-since-2008/