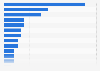
In the 2022/23 season, the Washington Capitals generated 85 million U.S. dollars from ticket sales. This was the same as the previous season and roughly 24 million U.S. dollars more than the 2019/20 season.
Washington Capitals gate receipts from 2010/11 to 2022/23
(in million U.S. dollars)
Characteristic
Gate receipts in million U.S. dollars
-
-
-
-
-
-
-
-
-
-
-
-
-
-
-
-
-
-
-
-
-
-
-
-
-
-
Exclusive Premium Statistic
To access all Premium Statistics, you need a paid Statista Account
Profit from the additional features of your individual account
Currently, you are using a shared account. To use individual functions (e.g., mark statistics as favourites, set
statistic alerts) please log in with your personal account.
If you are an admin, please authenticate by logging in again.
Learn more about how Statista can support your business.
Forbes. (December 14, 2023). Washington Capitals gate receipts from 2010/11 to 2022/23 (in million U.S. dollars) [Graph]. In Statista. Retrieved September 01, 2024, from https://www.statista.com/statistics/374758/washington-capitals-gate-receipts/
Forbes. "Washington Capitals gate receipts from 2010/11 to 2022/23 (in million U.S. dollars)." Chart. December 14, 2023. Statista. Accessed September 01, 2024. https://www.statista.com/statistics/374758/washington-capitals-gate-receipts/
Forbes. (2023). Washington Capitals gate receipts from 2010/11 to 2022/23 (in million U.S. dollars). Statista. Statista Inc.. Accessed: September 01, 2024. https://www.statista.com/statistics/374758/washington-capitals-gate-receipts/
Forbes. "Washington Capitals Gate Receipts from 2010/11 to 2022/23 (in Million U.S. Dollars)." Statista, Statista Inc., 14 Dec 2023, https://www.statista.com/statistics/374758/washington-capitals-gate-receipts/
Forbes, Washington Capitals gate receipts from 2010/11 to 2022/23 (in million U.S. dollars) Statista, https://www.statista.com/statistics/374758/washington-capitals-gate-receipts/ (last visited September 01, 2024)
Washington Capitals gate receipts from 2010/11 to 2022/23 (in million U.S. dollars) [Graph], Forbes, December 14, 2023. [Online]. Available: https://www.statista.com/statistics/374758/washington-capitals-gate-receipts/