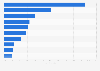
In 2020, Renault's net income amounted to a loss of some eight billion euros, down from about 19 million euros in 2019. Over half of this loss was attributed to Nissan's net income loss of over 4.9 billion euros.
Renault Group's net income from FY 2015 to FY 2020
(in million euros)
Profit from the additional features of your individual account
Currently, you are using a shared account. To use individual functions (e.g., mark statistics as favourites, set
statistic alerts) please log in with your personal account.
If you are an admin, please authenticate by logging in again.
Statista Accounts:
Access All Statistics. Starting from $468 / Year
Learn more about how Statista can support your business.
Renault. (September 21, 2021). Renault Group's net income from FY 2015 to FY 2020 (in million euros) [Graph]. In Statista. Retrieved August 08, 2022, from https://www.statista.com/statistics/387243/net-income-of-renault/
Renault. "Renault Group's net income from FY 2015 to FY 2020 (in million euros)." Chart. September 21, 2021. Statista. Accessed August 08, 2022. https://www.statista.com/statistics/387243/net-income-of-renault/
Renault. (2021). Renault Group's net income from FY 2015 to FY 2020 (in million euros). Statista. Statista Inc.. Accessed: August 08, 2022. https://www.statista.com/statistics/387243/net-income-of-renault/
Renault. "Renault Group's Net Income from Fy 2015 to Fy 2020 (in Million Euros)." Statista, Statista Inc., 21 Sep 2021, https://www.statista.com/statistics/387243/net-income-of-renault/
Renault, Renault Group's net income from FY 2015 to FY 2020 (in million euros) Statista, https://www.statista.com/statistics/387243/net-income-of-renault/ (last visited August 08, 2022)