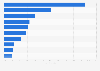
In 2020, Faurecia sold OEM automotive parts worth some 17.6 billion U.S. dollars. The France-based automotive supplier's global sales of OEM automotive parts decreased by almost 12 percent in 2020 compared with the previous year.
Faurecia's global OEM automotive parts sales from 2001 to 2020
(in million U.S. dollars)
The abbreviation OEM stands for original equipment manufacturer.
All figures are estimates. The figures for 2010 through 2018 are taken from previous editions of the publication; the figures through 2009 are taken from "On the Road 2011", published by the U.S. Department of Commerce in 2009.
Profit from the additional features of your individual account
Currently, you are using a shared account. To use individual functions (e.g., mark statistics as favourites, set
statistic alerts) please log in with your personal account.
If you are an admin, please authenticate by logging in again.
Learn more about how Statista can support your business.
Automotive News. (June 28, 2021). Faurecia's global OEM automotive parts sales from 2001 to 2020 (in million U.S. dollars) [Graph]. In Statista. Retrieved September 19, 2024, from https://www.statista.com/statistics/199728/global-sales-of-faurecia-since-2001/
Automotive News. "Faurecia's global OEM automotive parts sales from 2001 to 2020 (in million U.S. dollars)." Chart. June 28, 2021. Statista. Accessed September 19, 2024. https://www.statista.com/statistics/199728/global-sales-of-faurecia-since-2001/
Automotive News. (2021). Faurecia's global OEM automotive parts sales from 2001 to 2020 (in million U.S. dollars). Statista. Statista Inc.. Accessed: September 19, 2024. https://www.statista.com/statistics/199728/global-sales-of-faurecia-since-2001/
Automotive News. "Faurecia's Global Oem Automotive Parts Sales from 2001 to 2020 (in Million U.S. Dollars)." Statista, Statista Inc., 28 Jun 2021, https://www.statista.com/statistics/199728/global-sales-of-faurecia-since-2001/
Automotive News, Faurecia's global OEM automotive parts sales from 2001 to 2020 (in million U.S. dollars) Statista, https://www.statista.com/statistics/199728/global-sales-of-faurecia-since-2001/ (last visited September 19, 2024)
Faurecia's global OEM automotive parts sales from 2001 to 2020 (in million U.S. dollars) [Graph], Automotive News, June 28, 2021. [Online]. Available: https://www.statista.com/statistics/199728/global-sales-of-faurecia-since-2001/