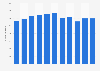
The statistic depicts the share of gaming revenue in the United States in 2018, by gambling segment. Commercial gaming made up 52 percent of the total U.S. gaming market in 2018.
Distribution of gaming revenue in the United States in 2018, by gaming segment
Profit from the additional features of your individual account
Currently, you are using a shared account. To use individual functions (e.g., mark statistics as favourites, set
statistic alerts) please log in with your personal account.
If you are an admin, please authenticate by logging in again.
Learn more about how Statista can support your business.
RubinBrown. (April 2, 2019). Distribution of gaming revenue in the United States in 2018, by gaming segment [Graph]. In Statista. Retrieved September 19, 2024, from https://www.statista.com/statistics/473643/gaming-revenue-gambling-segments-share-usa/
RubinBrown. "Distribution of gaming revenue in the United States in 2018, by gaming segment." Chart. April 2, 2019. Statista. Accessed September 19, 2024. https://www.statista.com/statistics/473643/gaming-revenue-gambling-segments-share-usa/
RubinBrown. (2019). Distribution of gaming revenue in the United States in 2018, by gaming segment. Statista. Statista Inc.. Accessed: September 19, 2024. https://www.statista.com/statistics/473643/gaming-revenue-gambling-segments-share-usa/
RubinBrown. "Distribution of Gaming Revenue in The United States in 2018, by Gaming Segment." Statista, Statista Inc., 2 Apr 2019, https://www.statista.com/statistics/473643/gaming-revenue-gambling-segments-share-usa/
RubinBrown, Distribution of gaming revenue in the United States in 2018, by gaming segment Statista, https://www.statista.com/statistics/473643/gaming-revenue-gambling-segments-share-usa/ (last visited September 19, 2024)
Distribution of gaming revenue in the United States in 2018, by gaming segment [Graph], RubinBrown, April 2, 2019. [Online]. Available: https://www.statista.com/statistics/473643/gaming-revenue-gambling-segments-share-usa/