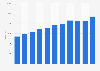
The annual sales turnover of salt, spices and aromatic plants for the retail trade in Sweden overall increased from 2009 to 2019. In 2019, the sales turnover of salt, spices and aromatic plants for the retail trade in Sweden was 367 million Swedish kronor.
Annual sales turnover of salt, spices and aromatic plants for the retail trade in Sweden from 2009 to 2019 (in million SEK)
Basic Account
Get to know the platform
You only have access to basic statistics.
This statistic is not included in your account.
Single Account
The ideal entry-level account for individual users
- Instant access to 1m statistics
- Download in XLS, PDF & PNG format
- Detailed references
$59 $39 / Month *
in the first 12 months
Corporate Account
Full access
Corporate solution including all features.
* Prices do not include sales tax.
Further Content: You might find this interesting as well
Statistics
- Sales turnover of sauces and seasonings in Sweden 2009-2019
- Value of spices imported into Iceland 2008-2018
- Import value of spices into Norway 2009-2019
- Per capita consumption of spices and mustard in Sweden 2009-2019
- Import value of organic spices into Denmark 2008-2019
- Export value of organic spices from Denmark 2008-2019
- Household consumption expenditure on spices, sauces and baby food in Sweden 200-2018
- Consumption volume of spices and mustard in Sweden 2009-2019
- U.S. retail sales of spices 2012 and 2016
- U.S. retail sales of spices 2018, by category
- Sales turnover of rice in Sweden 2009-2019
- Forecast: coffee, tea, cocoa and spice wholesale revenue Bulgaria 2008-2018
- Forecast: coffee, tea, cocoa and spice wholesale revenue Norway 2008-2018
- Industry revenue of “wholesale of coffee, tea, cocoa and spices“ in Denmark 2012-2024
Statistics Sweden. (September 30, 2020). Annual sales turnover of salt, spices and aromatic plants for the retail trade in Sweden from 2009 to 2019 (in million SEK) [Graph]. In Statista. Retrieved April 21, 2021, from https://www.statista.com/statistics/556001/sales-turnover-of-salt-spices-and-aromatic-plants-in-sweden/
Statistics Sweden. "Annual sales turnover of salt, spices and aromatic plants for the retail trade in Sweden from 2009 to 2019 (in million SEK)." Chart. September 30, 2020. Statista. Accessed April 21, 2021. https://www.statista.com/statistics/556001/sales-turnover-of-salt-spices-and-aromatic-plants-in-sweden/
Statistics Sweden. (2020). Annual sales turnover of salt, spices and aromatic plants for the retail trade in Sweden from 2009 to 2019 (in million SEK). Statista. Statista Inc.. Accessed: April 21, 2021. https://www.statista.com/statistics/556001/sales-turnover-of-salt-spices-and-aromatic-plants-in-sweden/
Statistics Sweden. "Annual Sales Turnover of Salt, Spices and Aromatic Plants for The Retail Trade in Sweden from 2009 to 2019 (in Million Sek)." Statista, Statista Inc., 30 Sep 2020, https://www.statista.com/statistics/556001/sales-turnover-of-salt-spices-and-aromatic-plants-in-sweden/
Statistics Sweden, Annual sales turnover of salt, spices and aromatic plants for the retail trade in Sweden from 2009 to 2019 (in million SEK) Statista, https://www.statista.com/statistics/556001/sales-turnover-of-salt-spices-and-aromatic-plants-in-sweden/ (last visited April 21, 2021)