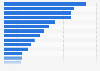
- Technology & Telecommunications›
- Software›
Container technology use among organizations worldwide 2017
Premium statistics
Industry-specific and extensively researched technical data (partially from exclusive partnerships).
A paid subscription is required for full access.
Most frequently used container technologies worldwide as of March 2017
Exclusive Premium Statistic

Share of respondents | |
---|---|
- | - |
- | - |
- | - |
- | - |
- | - |
- | - |
- | - |
- | - |
- | - |
- | - |
Share of respondents | |
---|---|
- | - |
- | - |
- | - |
- | - |
- | - |
- | - |
- | - |
- | - |
- | - |
- | - |
Exclusive Premium statistic
You need a Premium Account for unlimited access.
Full access to 1.5m statistics
Incl. source references
Available to download in PNG, PDF, XLS format
Exclusive Premium statistic
You need a Premium Account for unlimited access.
Full access to 1.5m statistics
Incl. source references
Available to download in PNG, PDF, XLS format
© Statista 2019
Chart type
Datalabels
Share on Social Media
Please be patient - this may take a moment
- Show sources information
- Show publisher information
- Release date
- April 2017
- Region
- Worldwide
- Survey time period
- March 2017
- Number of respondents
- 239 respondents
- Method of interview
- Online survey
- Supplementary notes
- Original question: "Which container technology does your organization run most frequently?"
More information
- Region
- Worldwide
- Survey time period
- March 2017
- Number of respondents
- 239 respondents
- Method of interview
- Online survey
- Supplementary notes
- Original question: "Which container technology does your organization run most frequently?"
Other interesting statistics


Statista Accounts: Access All Statistics. Starting from $588 / Year
Basic Account
Get to know the platform
You only have access to basic statistics.
This statistic is not included in your account!
Premium Account
Your perfect start with Statista
- Instant access to 1m statistics
- Download in XLS, PDF & PNG format
- Detailed references
$49 / Month *
Corporate Account
Full access
Corporate solution including all features.
Prices do not include sales tax
(New York residents only).
Leading companies trust Statista:


Related Studies: Available to Download in PDF or PPTX Format
All Information
in one Presentation
Software development
- 120 page/s
- English
- pptx
- Detailed references
Everything On "Software development" in One Document: Edited and Divided into Handy Chapters. Including Detailed References.
I think of Statista as Google for researchers. Statista provides you with the information you search for right away.Dr. Horst Stipp
EVP, Research & Innovation, Advertising Research Foundation
Statistics on "Software development"
- Market outlook
- Information technology (IT) spending on enterprise software worldwide, from 2009 to 2020 (in billion U.S. dollars)Enterprise software total worldwide expenditure 2009-2020
- Worldwide app revenue in 2016 and 2021, by category (in billion U.S. dollars)Global mobile app revenue 2021, by category
- Worldwide mobile app revenues in 2015, 2016 and 2020 (in billion U.S. dollars)Total global mobile app revenues 2015-2020
- Number of mobile app downloads worldwide in 2017, 2018 and 2022, by region (in billions)Annual number of global mobile app downloads 2017-2022, by region
- Most popular Apple App Store categories in September 2018, by share of available appsMost popular Apple App Store categories 2018
- Number of newly developed applications/games submitted for release to the iTunes App Store from 2012 to 2018Number of new apps/games submitted to the iTunes store per month 2012-2018
- Leading states in IT application/software spending in the United States in 2016 (in billion U.S. dollars)Leading states by application spending in U.S. 2016
- Research and development investments from the software to state economies in the United States in 2016, by key state (in million U.S. dollars)*State economy benefit from software R&D investment in the U.S. 2016, by key state
- Software development
- Testing tools used in software development worldwide in 2017Software development testing tools used worldwide 2017
- Programming/development tools used by software developers worldwide as of 2018Tools regularly used for software development worldwide 2018
- Programming languages used by software developers worldwide as of 2018, by deployment typeProgramming languages used for software development worldwide 2018
- Extent of DevOps adoption by software developers worldwide in 2017 and 2018DevOps adoption among software developers globally 2017-2018
- Frequency of software build deployment worldwide, in 2018, current vs desiredTypical and desired software build deployment frequencies worldwide 2018
- PC operating system distribution for software development worldwide, as of 2018Software development operating system distribution globally 2018
- Types of browsers used in web application testing worldwide from 2015 to 2018Types of browsers used for web application testing globally 2015-2018
- Adoption of agile development and continuous integration (CI) in software development worldwide from 2015 to 2018Use of agile development and continuous integration by software devs globally 2015-18
- Internet of Things development
- Platforms used to run connected devices in software projects, as of 2017Rank of platforms for IoT projects worldwide 2017
- Developers' plans for creating connected devices/Internet of Things software worldwide, as of 2016 (in millions)Global developer plans around connected devices/IoT software worldwide 2016
- Share of developers currently creating software for connected devices or the Internet of Things worldwide, as of 2016, by developer segmentDevelopers creating connected devices/IoT software by segment worldwide 2016
- Share of software developers currently creating connected devices/Internet of Things software, as of 2016, by regionShare of developers creating connected devices/IoT software 2016, by region
- Distribution of cloud services used in implementing Internet-of-Things (IoT) development, as of 2016, overall vs deployedTop cloud services used for Internet of Things projects 2016, overall vs deployed
- Distribution of cloud services used in implementing Internet-of-Things (IoT) development, as of 2016Top cloud services used for Internet of Things projects 2016
- Cloud and big data development
- Usage of cloud configuration tools worldwide in 2018Cloud configuration tools usage 2018
- Usage of cloud configuration tools worldwide in 2018, current and plannedCurrent and planned cloud computing configuration tools usage 2018
- Enterprise usage of cloud configuration tools worldwide in 2018, current and plannedPlanned cloud computing configuration tools usage among enterprises 2018
- Usage of cloud configuration tools in small and medium-sized businesses worldwide in 2018, current and plannedCurrent and planned cloud computing configuration tools usage among SMBs 2018
- Level of cloud-based test environment adoption for IT quality assurance and security testing from 2015 to 2017*Cloud-based test environment use for IT QA and security testing worldwide 2015-2017
- Containers and OpenStack development
- OpenStack global market revenues from 2014 and 2021 (in billion U.S. dollars)OpenStack forecast market size worldwide 2014-2021
- OpenStack global public cloud market revenues from 2016 to 2021 (in million U.S. dollars)OpenStack public cloud market size worldwide 2016-2021
- What container and PaaS tools are used to manage OpenStack applications?Container and PaaS tools used with OpenStack worldwide 2017, by purpose
- Leading business drivers of OpenStack adoption worldwide as of 2017Drivers of OpenStack business adoption worldwide 2017
- What tools are used to deploy and/or configure OpenStack clusters?Tools for deploying/configuring OpenStack clusters worldwide 2017, by purpose
- Most frequently used container technologies worldwide as of March 2017Container technology use among organizations worldwide 2017
- Use cases in which IT containers are employed worldwide as of 2018IT Container use cases in organizations worldwide 2018
- Platforms for IT container deployment in enterprise worldwide as of 2018IT container deployment platforms in organizations worldwide 2018
- Mobile app development
- Most-used mobile app monetization models according to mobile developers worldwide in 2017Most-used mobile app monetization models of developers 2017
- Most popular installed software development kits (SDKs) categories across global mobile apps in 2017Leading mobile app SDK categories worldwide 2017
- Greatest challenges in testing mobile and multi-channel (mobile, social, and traditional) applications from 2013 to 2018Mobile and multi-channel application testing challenges 2013-2018
- Focus areas for testing mobile applications from 2013 to 2017Mobile application testing focus areas 2013-2017
- Number of apps installed by mobile users in the United States as of 2nd quarter 2017Number of apps installed by U.S. mobile users 2017
- Median cost of mobile application development in the United States and Canada as of 2017, by platform (in U.S. dollars per hour)US/Canada mobile app development costs by platform 2017
- Mobile application user retention rate worldwide from 2012 to 2018Mobile application: user retention rate 2012-2018
- Percentage of mobile apps that have been used only once during the first six months of ownership from 2010 to 2018Share of mobile apps that have been used only once 2010-2018
- Game development
- Percentage of game developers working on game projects for selected platforms worldwide in 2018Game developers working on projects for selected platforms worldwide 2018
- Percentage of game developers working on selected game genres worldwide as of March 2017, by type of employmentGame developers working on selected genres worldwide 2017, by employment type
- Employment status among game developers worldwide from 2015 to 2017Game developer employment status worldwide 2015-2017
- Distribution of game developers worldwide from 2014 to 2017, by genderGame developer distribution worldwide 2014-2017, by gender
- Distribution of game developers worldwide as of March 2017, by regionGame developer distribution worldwide 2017, by region
- Distribution of game developers worldwide as of March 2017, by age groupGame developer distribution worldwide 2017, by age
- Most popular advertising software development kits (SDKs) used by Android gaming and non-gaming apps in 1st half 2017, by share of voiceTop advertising SDKs used by Android gaming and non-gaming apps 2017
Popular Related Keywords
Need help with using Statista for your research? Tutorials and first steps
Further Content: Statistics, Studies, and Topic Pages
Statistics
- Container technologies used in organizations worldwide 2018
- Top self-managed container orchestration tools 2016
- Top container management platforms in use 2016
- Drivers of enterprise open source technology adoption in UK 2016
- Net revenue of AFAS Software 2013-2018, by type
- Net result of AFAS Software 2013-2018
- Operating result of AFAS Software 2013-2018
- Net revenue of AFAS Software 2018, by country
- Net revenue of AFAS Software 2013-2018
- Top benefits of open-source software according to enterprises worldwide 2016
- Number of IT/software development employees in Hong Kong 2006-2016
- Global mobile app development agencies worldwide by business source 2015
- Leading sources of technical help for software developers worldwide 2015
- Ethereum vs. Bitcoin: developer code activity by type 2016
- Leading difficulties facing software developers worldwide 2015
- Major challenges in the use of software containers globally as of 2016
- Market size of image recognition China 2014-2025, by technique
- Software companies - number of employees worldwide
- U.S. application software publishing revenue in 2010, by software type
- Business communication software market share in Morocco 2018
Studies
- Software development
- 2018 Container Adoption Benchmark Survey
- Hope Versus Reality: Containers in 2016
- Microsoft
- IT industry in Germany
- UK App Economy 2014
- Developer Economics 2013: The tools report
- CA Technologies' Annual Report 2017
- Symantec 2017 Annual Report and Form 10-K
- The U.S. Software Industry
- Autodesk 2018 Annual Report on Form 10-K
- Enterprise DevOps - Building a service oriented organization
- Analysis of the Software Industry in Thailand
- SAP Annual Report 2016 on Form 20-F
- Autodesk 2017 Annual Report on Form 10-K
Statistics on the topic
Free statistics
- Worldwide mobile app revenues in 2015, 2016 and 2020 (in billion U.S. dollars)
- Most popular Apple App Store categories in September 2018, by share of available apps
- Programming/development tools used by software developers worldwide as of 2018
- PC operating system distribution for software development worldwide, as of 2018
- Weekly hours spent coding by software developers worldwide as of 2018
- Platforms used to run connected devices in software projects, as of 2017
- Developers' plans for creating connected devices/Internet of Things software worldwide, as of 2016 (in millions)
- Share of developers currently creating software for connected devices or the Internet of Things worldwide, as of 2016, by developer segment
- Share of software developers currently creating connected devices/Internet of Things software, as of 2016, by region
- Distribution of cloud services used in implementing Internet-of-Things (IoT) development, as of 2016, overall vs deployed
- Distribution of cloud services used in implementing Internet-of-Things (IoT) development, as of 2016
- Level of cloud-based test environment adoption for IT quality assurance and security testing from 2015 to 2017*
- OpenStack global market revenues from 2014 and 2021 (in billion U.S. dollars)
- OpenStack global public cloud market revenues from 2016 to 2021 (in million U.S. dollars)
- Greatest challenges in testing mobile and multi-channel (mobile, social, and traditional) applications from 2013 to 2018
- Focus areas for testing mobile applications from 2013 to 2017
- Median cost of mobile application development in the United States and Canada as of 2017, by platform (in U.S. dollars per hour)
- Percentage of mobile apps that have been used only once during the first six months of ownership from 2010 to 2018
- Percentage of game developers working on game projects for selected platforms worldwide in 2018
- Percentage of game developers working on selected game genres worldwide as of March 2017, by type of employment
- Employment status among game developers worldwide from 2015 to 2017
- Distribution of game developers worldwide from 2014 to 2017, by gender
- Distribution of game developers worldwide as of March 2017, by region
- Distribution of game developers worldwide as of March 2017, by age group
- Leading benefits of open-source software among enterprises worldwide as of 2016
- Distribution of mobile app development agency revenues worldwide, in 2015, by source of business
- Leading sources of technical assistance for software developers worldwide, as of 2015
- Most pressing long-running challenges facing software developers worldwide, as of 2015
- Breakdown of application software* publishing revenue in the U.S. in 2009 and 2010, by software type (in million U.S. dollars)
Premium Statistics
- Information technology (IT) spending on enterprise software worldwide, from 2009 to 2020 (in billion U.S. dollars)
- Worldwide app revenue in 2016 and 2021, by category (in billion U.S. dollars)
- Number of mobile app downloads worldwide in 2017, 2018 and 2022, by region (in billions)
- Number of newly developed applications/games submitted for release to the iTunes App Store from 2012 to 2018
- Leading states in IT application/software spending in the United States in 2016 (in billion U.S. dollars)
- Research and development investments from the software to state economies in the United States in 2016, by key state (in million U.S. dollars)*
- Leading states in application/software development and deployment spending in the United States in 2016 (in billion U.S. dollars)
- Testing tools used in software development worldwide in 2017
- Programming languages used by software developers worldwide as of 2018, by deployment type
- Extent of DevOps adoption by software developers worldwide in 2017 and 2018
- Frequency of software build deployment worldwide, in 2018, current vs desired
- Types of browsers used in web application testing worldwide from 2015 to 2018
- Adoption of agile development and continuous integration (CI) in software development worldwide from 2015 to 2018
- Usage of cloud configuration tools worldwide in 2018
- Usage of cloud configuration tools worldwide in 2018, current and planned
- Enterprise usage of cloud configuration tools worldwide in 2018, current and planned
- Usage of cloud configuration tools in small and medium-sized businesses worldwide in 2018, current and planned
- What container and PaaS tools are used to manage OpenStack applications?
- Leading business drivers of OpenStack adoption worldwide as of 2017
- What tools are used to deploy and/or configure OpenStack clusters?
- Most frequently used container technologies worldwide as of March 2017
- Use cases in which IT containers are employed worldwide as of 2018
- Platforms for IT container deployment in enterprise worldwide as of 2018
- Container orchestration tools used by organizations most frequently as of 2017
- Container orchestration tools in use as of April 2017
- Most-used mobile app monetization models according to mobile developers worldwide in 2017
- Most popular installed software development kits (SDKs) categories across global mobile apps in 2017
- Number of apps installed by mobile users in the United States as of 2nd quarter 2017
- Mobile application user retention rate worldwide from 2012 to 2018
- Most popular advertising software development kits (SDKs) used by Android gaming and non-gaming apps in 1st half 2017, by share of voice
- Most frequently used container IT technologies worldwide as of 2018
- Most popular self-managed container orchestration tools, as of 2016
- Most popular container management platforms, as of 2016
- Leading drivers of open source technology use in organisations in the UK, as of 2016
- Total net revenue of AFAS Software from 2013 to 2018, by type (in 1,000 euros)
- Total net result of AFAS Software from 2013 to 2018 (in 1,000 euros)
- Total operating result of AFAS Software from 2013 to 2018 (in 1,000 euros)
- Net revenue of AFAS Software in 2018, by country (in euros)
- Total net revenue of AFAS Software from 2013 to 2018 (in 1,000 euros)
- Number of IT/software development employees in Hong Kong from 2006 to 2016
- Ethereum vs. Bitcoin: developer code activity by type as of 2016
- Top challenges in software container usage worldwide as of the first quarter of 2016
- Market size of image recognition in China from 2014 to 2025, by technique (in million U.S. dollars)
- Number of employees of the world's leading software companies in 2008
- Market share of selected team collaboration technologies in Morocco as of October 2018
Statista Accounts: Access All Statistics. Starting from $588 / Year
Topics
About Statista
Statista offers dossiers and reports on over 170 industries. With Statista you are always able to make informed decisions and boost your work efficiency.
Internet & Telecommunications
- Social Media
- E-Commerce
- Online Video & Entertainment
- Advertising & Marketing
Consumer Goods & FMCG
- Alcoholic Beverages
- Cleaning Products
- Cosmetics & Personal Care
- Food & Nutrition
Retail & Trade
- Health & Hygiene
- International Trade
- Shopping Behavior
- Sports & Leisure
Travel, Tourism & Hospitality
- Business Travel
- Leisure Travel
- Accomodation
- Restaurants
Society
- Demographics
- Economy
- Education & Science
- Politics & Government
Transportation & Logistics
- Aviation
- Rail Transport
- Vehicles & Road Traffic
- Water Transport
Save statistic in .XLS format
You can only download this statistic as a Premium user.
Save statistic in .PNG format
You can only download this statistic as a Premium user.
Save statistic in .PDF format
You can only download this statistic as a Premium user.
Show source references
As a Premium user you get access to the detailed source references and background information about this statistic.
Show details about this statistic
As a Premium user you get access to background information and details about the release of this statistic.
Bookmark statistics
As soon as this statistic is updated, you will immediately be notified via e-mail.
Change statistics options
You need at least a Premium Account to use this feature.
Exclusive Corporate feature
This feature is limited to our corporate solutions.
Please contact us to get started with full access to dossiers, forecasts, studies and international data.
Corporate Account
Latest News

New Dossier: United States coal mining industry
U.S. coal production has steadily declined in the past decade, but has been in the news in recent years due to President Trump's desire to revitalize the industry. This document provides an overview of the key figures, leading companies, and the employment trends in the U.S. coal mining industry.

Global Consumer Survey offers PowerPoint export
This new export feature offers
- Structured graphical representation of the data
- Tailored target group analysis
- Option for further processing

New Dossier: E-commerce in Poland
The Polish e-commerce market is one of the fastest developing e-commerce markets in Europe. The latest data for Poland is presented in this dossier.

New Dossier: Plastic waste in the U.S.
Plastic waste is an issue of global concern. Since China banned the import of recycled plastic, the U.S. has had to make adjustments to its management of plastic waste. This dossier provides an overview of plastic waste in the U.S.

New Dossier: Hedge funds
This dossier provides an overview of hedge funds worldwide. Global hedge fund assets, performance, investors, and other topics are highlighted.

New exclusive OOH advertising data by OAAA
The Outdoor Advertising Association of America covers amongst others
- Number of billboards
- Outdoor advertising revenue
- Number of out-of-home displays

What happens after a no-deal Brexit?
Find data, perceptions & more about
- Economic consequences
- Impact on the labor market
- A second referendum

ecommerceDB.com: Ranking update – Spain
Understand the recent developments in the Spanish eCommerce market!
- URL-related revenues
- Relevant online store KPIs
- eCommerce-related contacts

Insights into the European banking sector
- Extended statistical dossier
- Insights, explanations & interpretations
- Challenges of the digital future

Dossier: Latin American online shopping events
eCommerce is rapidly becoming a part of the Latin American shopping culture. The dossier includes data on
- Regional online shopping events
- Events by country

Updated Brexit analysis in UK Industry Reports
The outline of potential impacts of Brexit on UK industries has been updated in the UK Industry Reports.

New Dossier: Digital Marketing in Italy
Italian enterprises invest significantly in digital marketing. Find out about
- Relevant aspects & KPIs
- New trends
- Different strategies

What is football all about, anyway?
Statista European Football Benchmark
- The big 5 European leagues
- All about the clubs & fans
- Sponsors & how they fit in

Payment methods in eCommerce
What are online shoppers' payment preferences around the world?
- Data on all payment methods
- Analysis for 50 countries
- Forecasts up to 2023

New Dossier: Foreign conflicts of Saudi Arabia
The kingdom of Saudi Arabia has faced political challenges.
- Perceptions & trade information
- Conflicts with Yemen, Iran, Qatar & Turkey
We use cookies to personalize contents and ads, offer social media features, and analyze access to our website. In your browser settings you can configure or disable this, respectively, and can delete any already placed cookies. For details, please see your browser’s Help section (by pressing F1). Please see our privacy statement for details about how we use data.