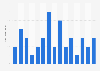
In financial year 2020, over two million people in Australia had a disposable personal income of 2,000 Australian dollars or more per week. On the other end of the spectrum, around 400,000 people had 99 Australian dollars or less in disposable income on a weekly basis.
Distribution of weekly disposable personal income in Australia in financial year 2020 (in 1,000 persons)
Basic Account
Get to know the platform
You only have access to basic statistics.
This statistic is not included in your account.
Starter Account
The ideal entry-level account for individual users
- Instant access to 1m statistics
- Download in XLS, PDF & PNG format
- Detailed references
$69 USD $49 USD / Month *
in the first 12 months
Professional Account
Full access
Business Solutions including all features.
* Prices do not include sales tax.
Further Content: You might find this interesting as well
Statistics
- Distribution of income in Taiwan in 2021, by income group
- Distribution of personal income levels before tax in France in 2018
- U.S. annual personal income 2022, by state
- Distribution of personal income levels before tax in Italy in 2018
- Distribution of personal income levels before tax in Belgium in 2018
- U.S. change in personal income, by state 2022
- Distribution of personal income levels before tax in the Netherlands in 2018
- Distribution of personal income levels before tax in Turkey in 2018
- U.S. change in per capita personal income by state 2010-2021
- Distribution of personal income levels before tax in Norway in 2018
- Disposable personal income in the U.S. 2000-2021
- U.S. per capita personal income, by state 2022
- Distribution of personal income levels before tax in Poland in 2018
- Per capita disposable personal income in the U.S. 2000-2021
- Distribution of personal income levels before tax in Spain in 2018
- Share of affluent Millennials in Vietnam 2019, by monthly income
- Distribution of personal income levels before tax in Denmark in 2018
- Distribution of personal income levels before tax in Sweden in 2018
- Per capita real GDP of Alaska 2000-2019
- Distribution of household expenses in Hungary 2020
Australian Bureau of Statistics. (April 28, 2022). Distribution of weekly disposable personal income in Australia in financial year 2020 (in 1,000 persons) [Graph]. In Statista. Retrieved June 02, 2023, from https://www.statista.com/statistics/614234/distribution-of-disposable-personal-income-australia/
Australian Bureau of Statistics. "Distribution of weekly disposable personal income in Australia in financial year 2020 (in 1,000 persons)." Chart. April 28, 2022. Statista. Accessed June 02, 2023. https://www.statista.com/statistics/614234/distribution-of-disposable-personal-income-australia/
Australian Bureau of Statistics. (2022). Distribution of weekly disposable personal income in Australia in financial year 2020 (in 1,000 persons). Statista. Statista Inc.. Accessed: June 02, 2023. https://www.statista.com/statistics/614234/distribution-of-disposable-personal-income-australia/
Australian Bureau of Statistics. "Distribution of Weekly Disposable Personal Income in Australia in Financial Year 2020 (in 1,000 Persons)." Statista, Statista Inc., 28 Apr 2022, https://www.statista.com/statistics/614234/distribution-of-disposable-personal-income-australia/
Australian Bureau of Statistics, Distribution of weekly disposable personal income in Australia in financial year 2020 (in 1,000 persons) Statista, https://www.statista.com/statistics/614234/distribution-of-disposable-personal-income-australia/ (last visited June 02, 2023)
Distribution of weekly disposable personal income in Australia in financial year 2020 (in 1,000 persons) [Graph], Australian Bureau of Statistics, April 28, 2022. [Online]. Available: https://www.statista.com/statistics/614234/distribution-of-disposable-personal-income-australia/