Try our business solution for free!

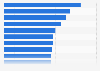
Generation distribution of attraction visitors in the U.S. 2018

Generation distribution of consumers that intend to visit an attraction in the United States in 2018

Exclusive Premium statistic

You need a Statista Account for unlimited access.

  • Full access to 1m statistics
  • Incl. source references
  • Available to download in PNG, PDF, XLS format
Statista Accounts

Access to this and all other statistics on 80,000 topics from

$468 USD / Year
$828 USD / Year

Download
Show detailed source information?
Register for free
Already a member?
Log in
Source

Use Ask Statista Research Service

Release date

February 2019

Region

North America, United States

Survey time period

2018

Number of respondents

1,500 leisure attraction visitors

Supplementary notes

Millennials: respondents born between 1981 and 1995.
Boomers: respondents born between 1945 and 1960
Includes respondents who said they will probably or definitely visit an attraction in 2018.

Citation formats
Statista Accounts: Access All Statistics. Starting from $468 USD / Year
Basic Account
Get to know the platform

You only have access to basic statistics.
This statistic is not included in your account.

Starter Account
The ideal entry-level account for individual users
  • Instant access to 1m statistics
  • Download in XLS, PDF & PNG format
  • Detailed references
$69 USD $39 USD / Month *
in the first 12 months
Professional Account
Full access

Business Solutions including all features.

* Prices do not include sales tax.

Statistics on Amusement and theme parks

Industry overview

5

Revenue of key players

6

Attendance by region

4

Roller coasters

6

Further related statistics

6
Statista Accounts: Access All Statistics. Starting from $468 USD / Year
Learn more about how Statista can support your business.