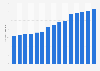
Visitors to U.S. national parks in 2021 spent 14.2 billion U.S. dollars in lodges outside said parks. Meanwhile, the expenditure of U.S. national park visitors on non-local day trips amounted to 2.2 billion dollars that same year.
Expenditure of visitors to national parks in the United States from 2012 to 2021, by category (in billion U.S. dollars)
Basic Account
Get to know the platform
You only have access to basic statistics.
This statistic is not included in your account.
Starter Account
The ideal entry-level account for individual users
- Instant access to 1m statistics
- Download in XLS, PDF & PNG format
- Detailed references
$199 USD / Month *
Professional Account
Full access
Business Solutions including all features.
* Prices do not include sales tax.
Other statistics that may interest you National park tourism in the U.S.
Industry overview
7
- Premium Statistic U.S. national and state park market size 2011-2022
- Premium Statistic National and state park industry business count in the U.S. 2012-2022
- Premium Statistic National and state park industry employee count in the U.S. 2012-2022
- Premium Statistic U.S. NPS sites visitation 2010-2022
- Basic Statistic Number of visitors to national parks and sites in the U.S., by type 2018-2022
- Premium Statistic Average daily visits to U.S. NPS sites 2019-2021, by month
- Premium Statistic Share of visits to U.S. national sites 2021, by site designation
Visitor spending
4
- Premium Statistic Economic contribution of national park visitor spending in the U.S. 2012-2021
- Premium Statistic NPS visitor spending in the U.S. 2021, by category
- Premium Statistic National park visitor spending in the U.S. 2012-2021, by category
- Premium Statistic Daily national park visitor spending in the U.S. 2010-2021, by category
Visitation figures
8
- Basic Statistic Number of visitors to Golden Gate National Recreational Area in the U.S. 2008-2022
- Basic Statistic Number of visitors to the Great Smoky Mountains National Park in the U.S. 2008-2022
- Basic Statistic Number of visitors to the Gateway National Recreation Area in the U.S. 2008-2022
- Basic Statistic Number of visitors to the George Washington Memorial Parkway in the U.S. 2008-2022
- Basic Statistic Number of visitors to Natchez Trace Parkway in the U.S. 2008-2022
- Basic Statistic Number of visitors to the Grand Canyon National Park in the U.S. 2008-2022
- Basic Statistic Number of visitors to the Vietnam Veterans Memorial in the U.S. 2008-2022
- Basic Statistic Number of visitors to Yosemite National Park in the U.S. 2008-2022
Outdoor recreation
5
- Premium Statistic Most popular outdoor activities in the U.S. 2021
- Premium Statistic Camping participation in the U.S. 2010-2021
- Premium Statistic Most used camping accommodation in North America 2018-2022, by number of households
- Premium Statistic Hiking participation in the U.S. 2010-2022
- Premium Statistic Fishing participation in the U.S. 2010-2022
Further related statistics
15
- Number of trips from Great Britain to National Parks in Scotland in 2015
- Expenditure of domestic and international summer travelers in Norway 2019
- Number of employees at Rocky Mountain National Park in 2018
- Number of visitors to Colonial National Historical Park in the U.S. 2008-2022
- Number of visitors to the Gateway Arch National Park in the U.S. 2008-2022
- Visitors to San Francisco Maritime National Historical Park in the U.S. 2008-2022
- Search and rescue operations in Yosemite National Park in the U.S. 2013-2021
- Per capita daily spend of inbound tourists in the Community of Madrid 2010-2022
- Italy: per capita expenditure of foreign tourists by continent 2017
- Outbound tourism expenditure as a share of GDP Saudi Arabia 2008-2021
- Number of recreational visitors to Rocky Mountain National Park in 2018
- International tourism spending in the Balearic Islands 2010-2022
- Average daily expenditure by international tourists in Andalusia 2004-2019
- Visitor numbers at Setonaikai National Park in Japan 2012-2021
- Number of visitors to Fathom Five Marine Park in Canada 2011-2023
Further Content: You might find this interesting as well
Statistics
- Number of trips from Great Britain to National Parks in Scotland in 2015
- Expenditure of domestic and international summer travelers in Norway 2019
- Number of employees at Rocky Mountain National Park in 2018
- Number of visitors to Colonial National Historical Park in the U.S. 2008-2022
- Number of visitors to the Gateway Arch National Park in the U.S. 2008-2022
- Visitors to San Francisco Maritime National Historical Park in the U.S. 2008-2022
- Search and rescue operations in Yosemite National Park in the U.S. 2013-2021
- Per capita daily spend of inbound tourists in the Community of Madrid 2010-2022
- Italy: per capita expenditure of foreign tourists by continent 2017
- Outbound tourism expenditure as a share of GDP Saudi Arabia 2008-2021
- Number of recreational visitors to Rocky Mountain National Park in 2018
- International tourism spending in the Balearic Islands 2010-2022
- Average daily expenditure by international tourists in Andalusia 2004-2019
- Visitor numbers at Setonaikai National Park in Japan 2012-2021
- Number of visitors to Fathom Five Marine Park in Canada 2011-2023
National Park Service. (June 1, 2022). Expenditure of visitors to national parks in the United States from 2012 to 2021, by category (in billion U.S. dollars) [Graph]. In Statista. Retrieved March 19, 2024, from https://www.statista.com/statistics/220980/total-spending-in-regions-around-us-national-parks/
National Park Service. "Expenditure of visitors to national parks in the United States from 2012 to 2021, by category (in billion U.S. dollars)." Chart. June 1, 2022. Statista. Accessed March 19, 2024. https://www.statista.com/statistics/220980/total-spending-in-regions-around-us-national-parks/
National Park Service. (2022). Expenditure of visitors to national parks in the United States from 2012 to 2021, by category (in billion U.S. dollars). Statista. Statista Inc.. Accessed: March 19, 2024. https://www.statista.com/statistics/220980/total-spending-in-regions-around-us-national-parks/
National Park Service. "Expenditure of Visitors to National Parks in The United States from 2012 to 2021, by Category (in Billion U.S. Dollars)." Statista, Statista Inc., 1 Jun 2022, https://www.statista.com/statistics/220980/total-spending-in-regions-around-us-national-parks/
National Park Service, Expenditure of visitors to national parks in the United States from 2012 to 2021, by category (in billion U.S. dollars) Statista, https://www.statista.com/statistics/220980/total-spending-in-regions-around-us-national-parks/ (last visited March 19, 2024)
Expenditure of visitors to national parks in the United States from 2012 to 2021, by category (in billion U.S. dollars) [Graph], National Park Service, June 1, 2022. [Online]. Available: https://www.statista.com/statistics/220980/total-spending-in-regions-around-us-national-parks/