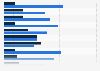
This statistic shows the number of households with elderly people in Hong Kong from 2010 to 2020, by type. In 2020, there were around 0.37 million domestic households in Hong Kong where all members of a household were elderly people.
Number of households with elderly members in Hong Kong from 2010 to 2020, by type
(in millions)
Characteristic
Part of household members are elders
All household members are elders
-
-
-
-
-
-
-
-
-
-
-
-
-
-
-
-
-
-
-
-
-
-
-
-
-
-
-
-
-
-
-
-
-
Exclusive Premium Statistic
To access all Premium Statistics, you need a paid Statista Account
Profit from the additional features of your individual account
Currently, you are using a shared account. To use individual functions (e.g., mark statistics as favourites, set
statistic alerts) please log in with your personal account.
If you are an admin, please authenticate by logging in again.
Learn more about how Statista can support your business.
Census and Statistics Department Hong Kong. (November 10, 2021). Number of households with elderly members in Hong Kong from 2010 to 2020, by type (in millions) [Graph]. In Statista. Retrieved July 27, 2024, from https://www.statista.com/statistics/962330/hong-kong-number-of-households-with-elderly-people/
Census and Statistics Department Hong Kong. "Number of households with elderly members in Hong Kong from 2010 to 2020, by type (in millions)." Chart. November 10, 2021. Statista. Accessed July 27, 2024. https://www.statista.com/statistics/962330/hong-kong-number-of-households-with-elderly-people/
Census and Statistics Department Hong Kong. (2021). Number of households with elderly members in Hong Kong from 2010 to 2020, by type (in millions). Statista. Statista Inc.. Accessed: July 27, 2024. https://www.statista.com/statistics/962330/hong-kong-number-of-households-with-elderly-people/
Census and Statistics Department Hong Kong. "Number of Households with Elderly Members in Hong Kong from 2010 to 2020, by Type (in Millions)." Statista, Statista Inc., 10 Nov 2021, https://www.statista.com/statistics/962330/hong-kong-number-of-households-with-elderly-people/
Census and Statistics Department Hong Kong, Number of households with elderly members in Hong Kong from 2010 to 2020, by type (in millions) Statista, https://www.statista.com/statistics/962330/hong-kong-number-of-households-with-elderly-people/ (last visited July 27, 2024)
Number of households with elderly members in Hong Kong from 2010 to 2020, by type (in millions) [Graph], Census and Statistics Department Hong Kong, November 10, 2021. [Online]. Available: https://www.statista.com/statistics/962330/hong-kong-number-of-households-with-elderly-people/