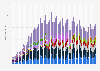
Unit sales of smart home devices reported a 24 percent year-on-year growth rate in the fourth quarter of 2018. Meanwhile, tablets registered the largest decrease, with a -28 percent year-on-year growth rate.
Change in unit sales of selected consumer devices in Latin America in 4th quarter 2018
Profit from the additional features of your individual account
Currently, you are using a shared account. To use individual functions (e.g., mark statistics as favourites, set
statistic alerts) please log in with your personal account.
If you are an admin, please authenticate by logging in again.
Learn more about how Statista can support your business.
IDC (@IDCLatin). (May 23, 2019). Change in unit sales of selected consumer devices in Latin America in 4th quarter 2018 [Graph]. In Statista. Retrieved September 20, 2024, from https://www.statista.com/statistics/971590/latin-america-devices-growth/
IDC (@IDCLatin). "Change in unit sales of selected consumer devices in Latin America in 4th quarter 2018." Chart. May 23, 2019. Statista. Accessed September 20, 2024. https://www.statista.com/statistics/971590/latin-america-devices-growth/
IDC (@IDCLatin). (2019). Change in unit sales of selected consumer devices in Latin America in 4th quarter 2018. Statista. Statista Inc.. Accessed: September 20, 2024. https://www.statista.com/statistics/971590/latin-america-devices-growth/
IDC (@IDCLatin). "Change in Unit Sales of Selected Consumer Devices in Latin America in 4th Quarter 2018." Statista, Statista Inc., 23 May 2019, https://www.statista.com/statistics/971590/latin-america-devices-growth/
IDC (@IDCLatin), Change in unit sales of selected consumer devices in Latin America in 4th quarter 2018 Statista, https://www.statista.com/statistics/971590/latin-america-devices-growth/ (last visited September 20, 2024)
Change in unit sales of selected consumer devices in Latin America in 4th quarter 2018 [Graph], IDC (@IDCLatin), May 23, 2019. [Online]. Available: https://www.statista.com/statistics/971590/latin-america-devices-growth/