
Federica Laricchia
Research expert covering the global consumer technology industry

Detailed statistics
Samsung Electronics: global revenue 2005-2023

Detailed statistics
Most valuable brands worldwide 2024

Detailed statistics
Research & development expenditure at Samsung Electronics 2009-2023

IT devices total spending worldwide 2012-2024
Global spending on devices (PCs, tablets, mobile phones, and printers) from 2012 to 2024 (in billion U.S. dollars)

Global smartphone shipments by quarter 2009-2024
Smartphone shipments worldwide from 4th quarter 2009 to 2nd quarter 2024 (in million units)

Worldwide tablet shipments 2010-2024, by quarter
Worldwide tablet shipments from 2nd quarter 2010 to 2nd quarter 2024 (in million units)

Television shipments worldwide forecast 2015-2024
Television unit shipments worldwide from 2015 to 2024 (in millions)

Semiconductor market revenue worldwide 1987-2025
Semiconductor market revenue worldwide from 1987 to 2025 (in billion U.S. dollars)

Most valuable technology brands worldwide 2023
Most valuable technology brands worldwide in 2023 (in billion U.S. dollars)
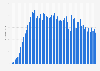
Samsung Electronics: global revenue 2005-2023
Samsung Electronics' global revenue from 2005 to 2023 (in trillion South Korean won/billion U.S. dollars)

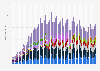
Quarterly revenue of Samsung Electronics 2011-2024, by business segment
Samsung Electronics' revenue from 1st quarter 2011 to 2nd quarter 2024, by product/business segment (in billion U.S. dollars)

Samsung Electronics' breakdown of revenue 2011-2023, by region
Samsung Electronics share of revenue from 2011 to 2023, by region

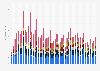
Samsung Electronics' operating profit 2009-2024, by quarter
Samsung Electronics' quarterly operating profit from 2009 to 2024 (in trillion South Korean won)
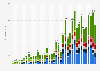
Research & development expenditure at Samsung Electronics 2009-2023
Global research & development expenditure at Samsung Electronics between 2009 and 2023 (in trillion South Korean won/ billion U.S. dollars)

Samsung Electronics employees worldwide 2009-2022
Number of Samsung Electronics employees worldwide from 2009 to 2022 (in 1,000s)

Patent ownership of Samsung Electronics 2023, by region
Number of registered patents owned by Samsung Electronics worldwide in 2023, by region
Global smartphone unit shipments of Samsung 2010-2024, by quarter
Smartphone unit shipments of Samsung worldwide by quarter from 1st quarter 2010 to 2nd quarter 2024 (in million units)

Samsung's market share of global smartphone shipments 2009-2024, by quarter
Samsung's share of global smartphone shipments from 2nd quarter 2009 to 2nd quarter 2024

Samsung tablet shipments worldwide 2012-2024, by quarter
Samsung tablet shipments worldwide from 2012 to 2024, by quarter (in million units)

Samsung tablet market share worldwide 2012-2024, by quarter
Samsung tablet market share worldwide from 2012 to 2024, by quarter

Display panel revenue of Samsung Electronics 2013-2023
Display panel revenue of Samsung Electronics from 2013 to 2023 (in trillion South Korean won)

Display panel operating profit of Samsung Electronics 2013-2023
Display panel operating profit of Samsung Electronics from 2013 to 2023 (in trillion South Korean won)

R&D expenses of Samsung Display 2015-2023
Research and development (R&D) expenses of Samsung Display from 2015 to 2023 (in trillion South Korean won)

Samsung Electronics' TV global market share 2016-2023
Samsung Electronics' TV global market share from 2016 to 2023, based on unit sales

Samsung semiconductor market revenue worldwide 2007-2023
Samsung semiconductor market revenue worldwide from 2007 to 2023 (in billion U.S. dollars)

Samsung semiconductor market revenue share worldwide 2008-2023
Samsung semiconductor market revenue share worldwide from 2008 to 2023

Semiconductor expenditure of Samsung Electronics 2011-2022
Samsung Electronics expenditure on semiconductors from 2011 to 2022 (in billion U.S. dollars)

Samsung Electronics' DRAM global market share 2015-2023
Samsung Electronics' dynamic random-access memory (DRAM) global market share from 2015 to 2023, based on revenue
Global smartphone shipments by vendor 2009-2024
Smartphone shipments by vendor worldwide from 4th quarter 2009 to 2nd quarter 2024 (in million units)

Quarterly smartphone market share worldwide by vendor 2009-2024
Global smartphone market share from 4th quarter 2009 to 2nd quarter 2024, by vendor

Foldable smartphone unit shipments worldwide 2024, by vendor
Unit shipments of foldable smartphones worldwide in 2024, by vendor (in millions)

Foldable smartphone market share worldwide 2024, by vendor
Market share of leading foldable smartphone vendors worldwide in 2024
Tablet vendor shipments worldwide 2012-2024, by quarter
Tablet vendor shipments worldwide from 2011 to 2024, by quarter (in millions)

Global market share held by tablet vendors 2011-2024
Tablet shipments market share by vendor worldwide from 2nd quarter 2011 to 2nd quarter 2024
Quarterly wearables shipments worldwide 2014-2024, by vendor
Wearables unit shipments worldwide by vendor from 1st quarter 2014 to 1st quarter 2024 (in millions)

Wearables shipments worldwide market share 2014-2022, by vendor
Market share of wearables unit shipments worldwide from 2014 to 2022, by vendor

Semiconductor companies market revenue worldwide 2009-2023
Semiconductor companies market revenue worldwide from 2009 to 2023 (in billion U.S. dollars)

Semiconductor foundries market revenue worldwide 2019-2024, by quarter
Semiconductor foundries market revenue worldwide from 2019 to 2024, by quarter (in million U.S. dollars)

DRAM manufacturers revenue worldwide 2011-2024, by quarter
DRAM manufacturers revenue worldwide from 2011 to 2024, by quarter (in million U.S. dollars)

NAND flash manufacturers revenue worldwide 2010-2024, by quarter
NAND flash manufacturers revenue worldwide from 2010 to 2024, by quarter (in million U.S. dollars)


Mon - Fri, 9am - 6pm (EST)
Mon - Fri, 9am - 5pm (SGT)
Mon - Fri, 10:00am - 6:00pm (JST)
Mon - Fri, 9:30am - 5pm (GMT)
Mon - Fri, 9am - 6pm (EST)


