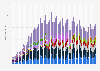
In December 2021, the Chinese smartphone manufacturer Oppo had a market share of 10.38 percent in Taiwan. It was the third most popular smartphone brand in the region after Apple and Samsung.
Monthly share of Oppo in the smartphone market in Taiwan from December 2017 to December 2020
Basic Account
Get to know the platform
You only have access to basic statistics.
This statistic is not included in your account.
Single Account
The ideal entry-level account for individual users
- Instant access to 1m statistics
- Download in XLS, PDF & PNG format
- Detailed references
$59 $39 / Month *
in the first 12 months
Corporate Account
Full access
Corporate solution including all features.
* Prices do not include sales tax.
Further Content: You might find this interesting as well
Statistics
- HTC's share in the Taiwan smartphone market 2017-2020
- Asus's share in the Taiwan smartphone market 2017-2020
- LG's share in the Hong Kong smartphone market 2017-2020
- HTC’s share in the Hong Kong smartphone market 2017-2020
- Sony’s share in the Hong Kong smartphone market 2017-2020
- Huawei's share in the Taiwan smartphone market 2019-2020
- Smartphone triple camera penetration rate worldwide 2019-2021
- Sony's share in the Taiwan smartphone market 2017-2020
- Global smartphone shipments share 2013-2018, by cost
- Market share of smartphone manufacturers in China Q3 2018
- Sony Ericsson's share in the Taiwan smartphone market 2017-2018
- Smartphone triple camera share by brand worldwide 2019
- Share of smartphone sales in the U.S. by carrier and manufacturer 2017
- Share of feature phone and smartphone sales Africa: 2010-2016
- Apple’s share in the Chinese smartphone market 2015
- OPPO's market share of global smartphone shipments 2015-2020, by quarter
- Singapore - brands of smartphones used for business purposes 2018
- Global smartphone unit shipments of OPPO 2015-2020, by quarter
- Share of smartphone shipments in Asia 2011-2016, by vendor
- Smartphone users in the Seychelles 2010-2025
StatCounter. (January 12, 2021). Monthly share of Oppo in the smartphone market in Taiwan from December 2017 to December 2020 [Graph]. In Statista. Retrieved March 05, 2021, from https://www.statista.com/statistics/955418/taiwan-oppo-smartphone-market-share/
StatCounter. "Monthly share of Oppo in the smartphone market in Taiwan from December 2017 to December 2020." Chart. January 12, 2021. Statista. Accessed March 05, 2021. https://www.statista.com/statistics/955418/taiwan-oppo-smartphone-market-share/
StatCounter. (2021). Monthly share of Oppo in the smartphone market in Taiwan from December 2017 to December 2020. Statista. Statista Inc.. Accessed: March 05, 2021. https://www.statista.com/statistics/955418/taiwan-oppo-smartphone-market-share/
StatCounter. "Monthly Share of Oppo in The Smartphone Market in Taiwan from December 2017 to December 2020." Statista, Statista Inc., 12 Jan 2021, https://www.statista.com/statistics/955418/taiwan-oppo-smartphone-market-share/
StatCounter, Monthly share of Oppo in the smartphone market in Taiwan from December 2017 to December 2020 Statista, https://www.statista.com/statistics/955418/taiwan-oppo-smartphone-market-share/ (last visited March 05, 2021)