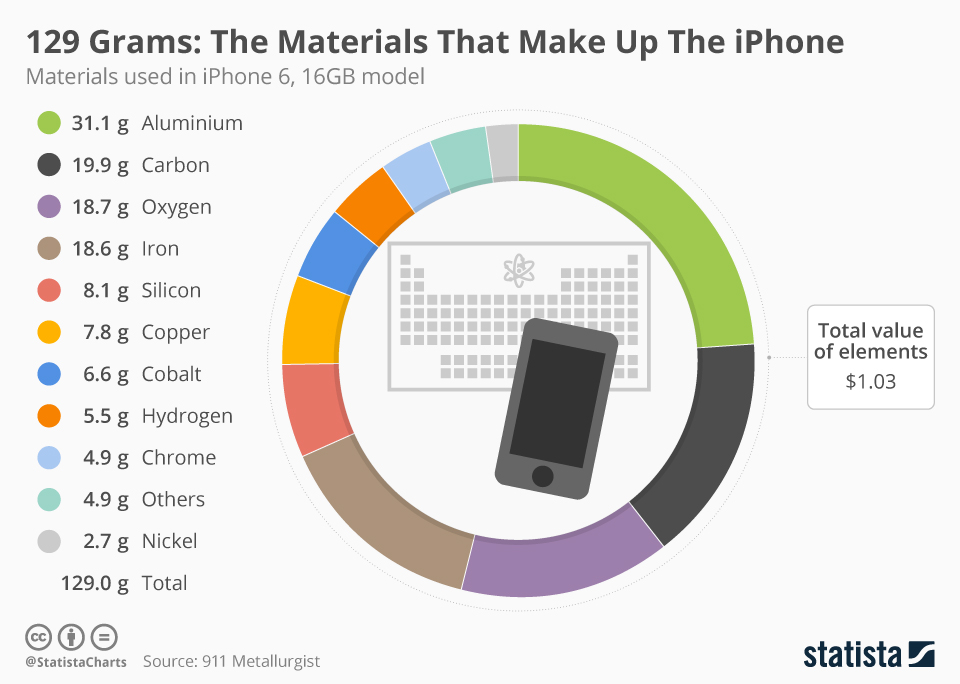
A mere $1.03 – that is the value of all raw materials in an iPhone 6 (16GB) ranging from aluminium (31.1g) to hydrogen (5.5g) and chrome (4.9g). The iPhone certainly is a device that is hyped and hailed by many but if you want to see it in quite rational terms, it is no more than “a composite of dredged-up earth”, as the Motherboard (Vice) appropriately describes it after analyzing the iPhone’s pulverized components.
And having said that, most of its ingredients are far from precious since 38.5 percent of the phone is simply made of aluminium and iron, worth $0.055 and $0.002, respectively. However, to its users the value of their iPhone may be huge – as a daily life navigator helping its owner through meetings and trips, pass the time commuting and eliminating all those moments of boredom.
Related Infographics
FAQ
- The Statista "Chart of the Day", made available under the Creative Commons License CC BY-ND 3.0, may be used and displayed without charge by all commercial and non-commercial websites. Use is, however, only permitted with proper attribution to Statista. When publishing one of these graphics, please include a backlink to the respective infographic URL. More Information
- The Statista "Chart of the Day" currently focuses on two sectors: "Media and Technology", updated daily and featuring the latest statistics from the media, internet, telecommunications and consumer electronics industries; and "Economy and Society", which current data from the United States and around the world relating to economic and political issues as well as sports and entertainment.
- For individual content and infographics in your Corporate Design, please visit our agency website www.statista.design
Any more questions?
Get in touch with us quickly and easily.
We are happy to help!
Do you still have questions?
Feel free to contact us anytime using our contact form or visit our FAQ page.
Your contact to the Infographics Newsroom
Statista Content & Design
Need infographics, animated videos, presentations, data research or social media charts?