The revenue in the accommodation, restaurants & nightlife market in the United Arab Emirates was forecast to continuously increase between 2023 and 2026 by in total 0.3 billion U.S. dollars (+3.52 percent). The revenue is estimated to amount to 8.81 billion U.S. dollars in 2026.Find further information concerning the accommodation, restaurants & nightlife market and its segments. Here you can find the
Revenue of the accommodation, restaurants & nightlife market in the United Arab Emirates from 2014 to 2026 (in billion U.S. dollars)
Other statistics that may interest you
Pasta
8
- Premium Statistic U.S. retail price of spaghetti 1995-2022
- Premium Statistic U.S. pasta and rice dollar sales by category 2018, by category
- Premium Statistic U.S. pasta and rice unit sales by category 2018, by category
- Premium Statistic U.S. pasta and rice market: average price per unit by category 2018, by category
- Premium Statistic U.S. private label market: pasta dollar sales by category 2019, by category
- Premium Statistic U.S. private label market: pasta dollar sales share by category 2019
- Premium Statistic U.S. private label market: pasta and rice unit sales by category 2018, by category
- Premium Statistic U.S. private label market: average price of pasta and rice by category 2018
Pizza
8
- Premium Statistic U.S. frozen pizza sales from 2015 to 2021
- Premium Statistic Sales of frozen pizza in the United States in 2019, by segment
- Premium Statistic Frozen pizza: market share of leading vendors in the U.S. 2019
- Premium Statistic Leading frozen pizza brands year-on-year sales growth U.S. 2020
- Premium Statistic U.S. dollar sales of the leading refrigerated pizza vendors 2021
- Premium Statistic U.S. unit sales of the leading refrigerated pizza vendors 2021
- Premium Statistic U.S. dollar sales of the leading pizza and pizza kit brands 2022
- Premium Statistic Sales share of the leading frozen pizza dough/crust vendors in the U.S. 2021
Cheese
3
Consumer behavior
7
- Basic Statistic U.S. per capita consumption of Italian cheese 2000-2021
- Premium Statistic Brands of frozen pizzas (bought frozen) consumed in the U.S. 2011-2020
- Premium Statistic Amounts of frozen pizzas (bought frozen) consumed in the U.S. 2011-2020
- Premium Statistic Frozen pizza penetration in U.S. households in 2019, by income
- Premium Statistic Usage of dry packaged pasta in the U.S. 2014-2024
- Premium Statistic Usage of spaghetti / pasta sauce in the U.S. 2011-2024
- Premium Statistic Most used brands of spaghetti / pasta sauce in the U.S. 2011-2020
Further related statistics
15
- Industry revenue of “accommodation and food service activities“ in Saudi Arabia 2012-2024
- Industry revenue of “social work activities without accommodation“ in Saudi Arabia 2012-2024
- Revenue of the food & beverage service activities industry in Saudi Arabia 2013-2025
- Industry revenue of “accommodation“ in Saudi Arabia 2012-2024
- Industry revenue of “Manufacture of food products“ in Israel 2012-2024
- Industry revenue of “manufacture of food products“ in Saudi Arabia 2012-2024
- Industry revenue of "Manufacture of food products" in India 2012-2024
- Industry revenue of “manufacture of foods“ in China 2012-2025
- Industry revenue of “Wholesale of fresh food and dried, salted and frozen food“ in South Korea 2012-2024
- Industry revenue of “processing of food from agricultural products“ in China 2012-2025
- Industry revenue of "Manufacture of other food products" in India 2012-2024
- Food: Weekly household expenditure in the United Kingdom (UK) 2018, by gross income
- Understanding of the term 'local food' in Great Britain 2017
- Switzerland: turnover of accommodation & food service activities industry 2011-2020
- Accommodation used by international tourists in Iceland 2016
Further Content: You might find this interesting as well
Statistics
- Industry revenue of “accommodation and food service activities“ in Saudi Arabia 2012-2024
- Industry revenue of “social work activities without accommodation“ in Saudi Arabia 2012-20...
- Revenue of the food & beverage service activities industry in Saudi Arabia 2013-2025
- Industry revenue of “accommodation“ in Saudi Arabia 2012-2024
- Industry revenue of “Manufacture of food products“ in Israel 2012-2024
- Industry revenue of “manufacture of food products“ in Saudi Arabia 2012-2024
- Industry revenue of "Manufacture of food products" in India 2012-2024
- Industry revenue of “manufacture of foods“ in China 2012-2025
- Industry revenue of “Wholesale of fresh food and dried, salted and frozen food“ in South K...
- Industry revenue of “processing of food from agricultural products“ in China 2012-2025
- Industry revenue of "Manufacture of other food products" in India 2012-2024
- Food: Weekly household expenditure in the United Kingdom (UK) 2018, by gross income
- Understanding of the term 'local food' in Great Britain 2017
- Switzerland: turnover of accommodation & food service activities industry 2011-2020
- Accommodation used by international tourists in Iceland 2016
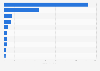
FCSA (UAE). (February 21, 2023). Revenue of the accommodation, restaurants & nightlife market in the United Arab Emirates from 2014 to 2026 (in billion U.S. dollars) [Graph]. In Statista. Retrieved June 10, 2023, from https://www.statista.com/forecasts/1075691/accommodation-and-food-service-activities-revenue-in-united-arab-emirates
FCSA (UAE). "Revenue of the accommodation, restaurants & nightlife market in the United Arab Emirates from 2014 to 2026 (in billion U.S. dollars)." Chart. February 21, 2023. Statista. Accessed June 10, 2023. https://www.statista.com/forecasts/1075691/accommodation-and-food-service-activities-revenue-in-united-arab-emirates
FCSA (UAE). (2023). Revenue of the accommodation, restaurants & nightlife market in the United Arab Emirates from 2014 to 2026 (in billion U.S. dollars). Statista. Statista Inc.. Accessed: June 10, 2023. https://www.statista.com/forecasts/1075691/accommodation-and-food-service-activities-revenue-in-united-arab-emirates
FCSA (UAE). "Revenue of The Accommodation, Restaurants & Nightlife Market in The United Arab Emirates from 2014 to 2026 (in Billion U.S. Dollars)." Statista, Statista Inc., 21 Feb 2023, https://www.statista.com/forecasts/1075691/accommodation-and-food-service-activities-revenue-in-united-arab-emirates
FCSA (UAE), Revenue of the accommodation, restaurants & nightlife market in the United Arab Emirates from 2014 to 2026 (in billion U.S. dollars) Statista, https://www.statista.com/forecasts/1075691/accommodation-and-food-service-activities-revenue-in-united-arab-emirates (last visited June 10, 2023)
Revenue of the accommodation, restaurants & nightlife market in the United Arab Emirates from 2014 to 2026 (in billion U.S. dollars) [Graph], FCSA (UAE), February 21, 2023. [Online]. Available: https://www.statista.com/forecasts/1075691/accommodation-and-food-service-activities-revenue-in-united-arab-emirates