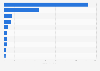
This graph shows the dollar sales of the leading froze pizza brands of the United States as of July 2022. Di Giorno was the top ranked refrigerated pizza brand of the United States during this period with approximately 295.43 million U.S. dollars in sales in 2022.
Dollar sales of the leading frozen pizza brands of the United States in 2022 (in million U.S. dollars)
Basic Account
Get to know the platform
You only have access to basic statistics.
This statistic is not included in your account.
Starter Account
The ideal entry-level account for individual users
- Instant access to 1m statistics
- Download in XLS, PDF & PNG format
- Detailed references
$69 USD $49 USD / Month *
in the first 12 months
Professional Account
Full access
Business Solutions including all features.
* Prices do not include sales tax.
Statistics on Italian foods in the United States
Pasta
8
- Premium Statistic U.S. retail price of spaghetti 1995-2022
- Premium Statistic U.S. pasta and rice dollar sales by category 2018, by category
- Premium Statistic U.S. pasta and rice unit sales by category 2018, by category
- Premium Statistic U.S. pasta and rice market: average price per unit by category 2018, by category
- Premium Statistic U.S. private label market: pasta dollar sales by category 2019, by category
- Premium Statistic U.S. private label market: pasta dollar sales share by category 2019
- Premium Statistic U.S. private label market: pasta and rice unit sales by category 2018, by category
- Premium Statistic U.S. private label market: average price of pasta and rice by category 2018
Pizza
8
- Premium Statistic U.S. frozen pizza sales from 2015 to 2021
- Premium Statistic Sales of frozen pizza in the United States in 2019, by segment
- Premium Statistic Frozen pizza: market share of leading vendors in the U.S. 2019
- Premium Statistic Leading frozen pizza brands year-on-year sales growth U.S. 2020
- Premium Statistic U.S. dollar sales of the leading refrigerated pizza vendors 2021
- Premium Statistic U.S. unit sales of the leading refrigerated pizza vendors 2021
- Premium Statistic U.S. dollar sales of the leading pizza and pizza kit brands 2022
- Premium Statistic Sales share of the leading frozen pizza dough/crust vendors in the U.S. 2021
Cheese
3
Consumer behavior
7
- Basic Statistic U.S. per capita consumption of Italian cheese 2000-2021
- Premium Statistic Brands of frozen pizzas (bought frozen) consumed in the U.S. 2011-2020
- Premium Statistic Amounts of frozen pizzas (bought frozen) consumed in the U.S. 2011-2020
- Premium Statistic Frozen pizza penetration in U.S. households in 2019, by income
- Premium Statistic Usage of dry packaged pasta in the U.S. 2014-2024
- Premium Statistic Usage of spaghetti / pasta sauce in the U.S. 2011-2024
- Premium Statistic Most used brands of spaghetti / pasta sauce in the U.S. 2011-2020
Further related statistics
15
- U.S. unit sales of the leading pizza and pizza kit brands 2015
- U.S. pizza retail sales 2014-2019
- Frozen pizza market: sales of the leading brands in the U.S. 2011-2017
- U.S. frozen pizza production revenue growth from 2014 to 2020
- Amount of California Pizza Kitchen pizzas used last 30 days in the U.S. 2020
- Amount of store brand pizzas used last 30 days in the U.S. 2020
- Amount of Healthy Choice pizzas used last 30 days in the U.S. 2020
- Amount of Mr. P's pizzas used last 30 days in the U.S. 2020
- Amount of Red Baron pizzas used last 30 days in the U.S. 2020
- Export value of pizza from Norway 2013-2021
- Most used brands of pizza sauce in the U.S. 2020
- Import volume of pizza into Norway 2013-2021
- Sales value of frozen pizza and subs in Canada 2015-2016
- Quantity of pizza, rice and pasta consumed in the United Kingdom 2008-2012, by age
- Prepared food production volume Japan 2019, by package type
Further Content: You might find this interesting as well
Statistics
- U.S. unit sales of the leading pizza and pizza kit brands 2015
- U.S. pizza retail sales 2014-2019
- Frozen pizza market: sales of the leading brands in the U.S. 2011-2017
- U.S. frozen pizza production revenue growth from 2014 to 2020
- Amount of California Pizza Kitchen pizzas used last 30 days in the U.S. 2020
- Amount of store brand pizzas used last 30 days in the U.S. 2020
- Amount of Healthy Choice pizzas used last 30 days in the U.S. 2020
- Amount of Mr. P's pizzas used last 30 days in the U.S. 2020
- Amount of Red Baron pizzas used last 30 days in the U.S. 2020
- Export value of pizza from Norway 2013-2021
- Most used brands of pizza sauce in the U.S. 2020
- Import volume of pizza into Norway 2013-2021
- Sales value of frozen pizza and subs in Canada 2015-2016
- Quantity of pizza, rice and pasta consumed in the United Kingdom 2008-2012, by age
- Prepared food production volume Japan 2019, by package type
Frozen & Refrigerated Buyer. (September 30, 2022). Dollar sales of the leading frozen pizza brands of the United States in 2022 (in million U.S. dollars) [Graph]. In Statista. Retrieved May 29, 2023, from https://www.statista.com/statistics/189634/top-refrigerated-pizza-and-pizza-kit-brands-in-the-united-states/
Frozen & Refrigerated Buyer. "Dollar sales of the leading frozen pizza brands of the United States in 2022 (in million U.S. dollars)." Chart. September 30, 2022. Statista. Accessed May 29, 2023. https://www.statista.com/statistics/189634/top-refrigerated-pizza-and-pizza-kit-brands-in-the-united-states/
Frozen & Refrigerated Buyer. (2022). Dollar sales of the leading frozen pizza brands of the United States in 2022 (in million U.S. dollars). Statista. Statista Inc.. Accessed: May 29, 2023. https://www.statista.com/statistics/189634/top-refrigerated-pizza-and-pizza-kit-brands-in-the-united-states/
Frozen & Refrigerated Buyer. "Dollar Sales of The Leading Frozen Pizza Brands of The United States in 2022 (in Million U.S. Dollars)." Statista, Statista Inc., 30 Sep 2022, https://www.statista.com/statistics/189634/top-refrigerated-pizza-and-pizza-kit-brands-in-the-united-states/
Frozen & Refrigerated Buyer, Dollar sales of the leading frozen pizza brands of the United States in 2022 (in million U.S. dollars) Statista, https://www.statista.com/statistics/189634/top-refrigerated-pizza-and-pizza-kit-brands-in-the-united-states/ (last visited May 29, 2023)
Dollar sales of the leading frozen pizza brands of the United States in 2022 (in million U.S. dollars) [Graph], Frozen & Refrigerated Buyer, September 30, 2022. [Online]. Available: https://www.statista.com/statistics/189634/top-refrigerated-pizza-and-pizza-kit-brands-in-the-united-states/