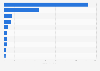
The statistic shows the sales growth of deli specialty cheese in the United States in 2019, by type. During the 52 weeks ending January 27, 2019, sales of blend deli cheese grew by 8.6 percent in the United States.
Sales growth of deli specialty cheese in the United States in 2019, by type*
Characteristic
Sales growth
-
-
-
-
-
-
-
-
-
-
-
-
-
-
-
-
-
-
-
-
Exclusive Premium Statistic
To access all Premium Statistics, you need a paid Statista Account
*Deli specialty cheese includes random-weight cheese items that are self-service (such as grab-and-go sliced, and/or fixed weight (UPC) cheese items) in brands, flavors and forms commonly found in the deli department (outside of the traditional dairy case).
Profit from the additional features of your individual account
Currently, you are using a shared account. To use individual functions (e.g., mark statistics as favourites, set
statistic alerts) please log in with your personal account.
If you are an admin, please authenticate by logging in again.
Learn more about how Statista can support your business.
Winsight Grocery Business. (April 30, 2019). Sales growth of deli specialty cheese in the United States in 2019, by type* [Graph]. In Statista. Retrieved September 01, 2024, from https://www.statista.com/statistics/1009326/sales-growth-of-deli-specialty-cheese-by-type-us/
Winsight Grocery Business. "Sales growth of deli specialty cheese in the United States in 2019, by type*." Chart. April 30, 2019. Statista. Accessed September 01, 2024. https://www.statista.com/statistics/1009326/sales-growth-of-deli-specialty-cheese-by-type-us/
Winsight Grocery Business. (2019). Sales growth of deli specialty cheese in the United States in 2019, by type*. Statista. Statista Inc.. Accessed: September 01, 2024. https://www.statista.com/statistics/1009326/sales-growth-of-deli-specialty-cheese-by-type-us/
Winsight Grocery Business. "Sales Growth of Deli Specialty Cheese in The United States in 2019, by Type*." Statista, Statista Inc., 30 Apr 2019, https://www.statista.com/statistics/1009326/sales-growth-of-deli-specialty-cheese-by-type-us/
Winsight Grocery Business, Sales growth of deli specialty cheese in the United States in 2019, by type* Statista, https://www.statista.com/statistics/1009326/sales-growth-of-deli-specialty-cheese-by-type-us/ (last visited September 01, 2024)
Sales growth of deli specialty cheese in the United States in 2019, by type* [Graph], Winsight Grocery Business, April 30, 2019. [Online]. Available: https://www.statista.com/statistics/1009326/sales-growth-of-deli-specialty-cheese-by-type-us/