As estimated by the Statista Mobility Market Insights, more than two-thirds of the revenue in the global travel and tourism market came from online sales channels. While the online segment generated roughly 60 percent of income in 2017, online sales channels were expected to account for 69 percent of the
Revenue share of sales channels of the travel and tourism market worldwide from 2017 to 2027
Other statistics that may interest you
Overview
8
- Basic Statistic Total contribution of travel and tourism to GDP worldwide 2019-2021
- Basic Statistic Travel and tourism: share of global GDP 2000-2021
- Basic Statistic Leading global travel markets by travel and tourism contribution to GDP 2019-2021
- Basic Statistic Global leisure travel spend 2019-2021
- Premium Statistic Global business travel spending 2001-2021
- Premium Statistic Number of international tourist arrivals worldwide 1950-2022
- Basic Statistic Number of international tourist arrivals worldwide 2005-2022, by region
- Basic Statistic Travel and tourism employment worldwide 2019-2023
Hotels
6
- Premium Statistic Global hotel and resort industry market size worldwide 2013-2023
- Premium Statistic Most valuable hotel brands worldwide 2022, by brand value
- Basic Statistic Leading hotel companies worldwide 2021, by number of properties
- Premium Statistic Hotel openings worldwide 2021-2024
- Premium Statistic Hotel room openings worldwide 2021-2024
- Premium Statistic Countries with the most hotel construction projects in the pipeline worldwide 2022
Transport
5
- Premium Statistic International air passenger traffic - leading airports worldwide 2021
- Basic Statistic Leading airlines worldwide based on total number of passengers 2020
- Premium Statistic Most congested cities in the world 2021
- Premium Statistic Daily ridership of bus rapid transit systems worldwide by region 2023
- Premium Statistic Carbon footprint of international tourism transport worldwide 2005-2030, by type
Attractions
4
- Basic Statistic Leading cities by number of cultural attractions worldwide as of June 2021
- Basic Statistic Leading countries worldwide with the highest number of museums 2021
- Premium Statistic Leading museums by highest attendance worldwide 2019-2021
- Basic Statistic Most visited amusement and theme parks worldwide 2019-2021
Online travel market
6
- Premium Statistic Online travel market size worldwide 2020-2030
- Premium Statistic Revenue of leading online travel agencies (OTAs) worldwide 2019-2021
- Basic Statistic Leading online travel companies worldwide 2022, by market cap
- Premium Statistic Leading online travel companies worldwide 2020-2022, by revenue CAGR
- Premium Statistic Leading online travel companies worldwide 2022-2023, by EV/EBITDA
- Premium Statistic Marketing expenses of leading online travel agencies (OTAs) worldwide 2019-2021
Selected trends
6
- Premium Statistic Global travelers who believe in the importance of green travel 2022
- Premium Statistic Global travelers opinions on the efforts of tourism sectors to be sustainable 2020
- Premium Statistic Airbnb revenue worldwide 2017-2022
- Premium Statistic Airbnb nights and experiences booked worldwide 2017-2022
- Premium Statistic Main technologies to increase travel confidence among travelers worldwide 2021
- Premium Statistic Technologies adopted by hotels worldwide as of November 2021, by date of use
Impact of the coronavirus
5
- Premium Statistic COVID-19: global change in international tourist arrivals 2019-2022
- Premium Statistic COVID-19 impact on international tourist arrivals worldwide 2020-Q1 2023, by region
- Premium Statistic Change in international tourist arrivals worldwide 2020-2021, by sub-region
- Basic Statistic COVID-19: job loss in travel and tourism worldwide 2020-2021, by region
- Basic Statistic COVID-19: job loss in travel and tourism worldwide 2020-2021, by country
Outlook
4
- Premium Statistic Travel and tourism revenue worldwide 2018-2027, by segment
- Premium Statistic 
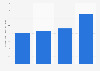
Distribution of sales channels in the travel and tourism market worldwide 2017-2027
- Premium Statistic Inbound tourism visitor growth worldwide 2020-2024, by region
- Premium Statistic Outbound tourism visitor growth worldwide 2020-2024, by region
Further related statistics
17
- Trainees for tourism and travel merchandising in Germany 2002-2021
- Contribution of travel and tourism to GDP in the U.S. 2013-2017, by visitor origin
- Contribution of travel and tourism to employment in Canada 2016-2017, by type
- GVA of accommodation and food service in Spain 2010-2021
- Travel and tourism contribution to employment in Greece 2017, by type
- Travel and tourism's direct contribution to employment in Germany 2012-2028
- Travel and tourism contribution to GDP in Turkey 2017, by type
- Travel & tourism employment direct impact in South Korea 2012-2028
- Tourism GDP in the Balearics 2016-2021
- Travel and tourism contribution to GDP in Belgium 2017, by type
- Travel product online bookings in Morocco 2022
- Brazil: retail sales revenue 2010-2016, by channel
- Brazil: furniture & home furnishings retailers 2010-2016, by channel
- Number of hotels in Angola 2015-2019
- Consumer spending growth rate on accommodation in the U.S. 2021, by week
- Average number of nights spent in hotels in Slovenia 2010-2021
- Revenues distribution share of olive cooperatives in Italy 2015, by sales channel
Further Content: You might find this interesting as well
Statistics
- Trainees for tourism and travel merchandising in Germany 2002-2021
- Contribution of travel and tourism to GDP in the U.S. 2013-2017, by visitor origin
- Contribution of travel and tourism to employment in Canada 2016-2017, by type
- GVA of accommodation and food service in Spain 2010-2021
- Travel and tourism contribution to employment in Greece 2017, by type
- Travel and tourism's direct contribution to employment in Germany 2012-2028
- Travel and tourism contribution to GDP in Turkey 2017, by type
- Travel & tourism employment direct impact in South Korea 2012-2028
- Tourism GDP in the Balearics 2016-2021
- Travel and tourism contribution to GDP in Belgium 2017, by type
- Travel product online bookings in Morocco 2022
- Brazil: retail sales revenue 2010-2016, by channel
- Brazil: furniture & home furnishings retailers 2010-2016, by channel
- Number of hotels in Angola 2015-2019
- Consumer spending growth rate on accommodation in the U.S. 2021, by week
- Average number of nights spent in hotels in Slovenia 2010-2021
- Revenues distribution share of olive cooperatives in Italy 2015, by sales channel
Statista. (January 1, 2023). Revenue share of sales channels of the travel and tourism market worldwide from 2017 to 2027 [Graph]. In Statista. Retrieved June 04, 2023, from https://www.statista.com/forecasts/1239068/sales-channels-travel-tourism-worldwide
Statista. "Revenue share of sales channels of the travel and tourism market worldwide from 2017 to 2027." Chart. January 1, 2023. Statista. Accessed June 04, 2023. https://www.statista.com/forecasts/1239068/sales-channels-travel-tourism-worldwide
Statista. (2023). Revenue share of sales channels of the travel and tourism market worldwide from 2017 to 2027. Statista. Statista Inc.. Accessed: June 04, 2023. https://www.statista.com/forecasts/1239068/sales-channels-travel-tourism-worldwide
Statista. "Revenue Share of Sales Channels of The Travel and Tourism Market Worldwide from 2017 to 2027." Statista, Statista Inc., 1 Jan 2023, https://www.statista.com/forecasts/1239068/sales-channels-travel-tourism-worldwide
Statista, Revenue share of sales channels of the travel and tourism market worldwide from 2017 to 2027 Statista, https://www.statista.com/forecasts/1239068/sales-channels-travel-tourism-worldwide (last visited June 04, 2023)
Revenue share of sales channels of the travel and tourism market worldwide from 2017 to 2027 [Graph], Statista, January 1, 2023. [Online]. Available: https://www.statista.com/forecasts/1239068/sales-channels-travel-tourism-worldwide