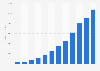
This statistic shows the revenue of the hardware industry from 2012 and 2018. In 2018, the revenue of the Singaporean hardware market reached around 181.6 billion Singapore dollars, indicating an increase of over 100 billion dollars compared to 2012.
Market value of the hardware industry in Singapore from 2012 to 2018 (in billion Singapore dollars)
Basic Account
Get to know the platform
You only have access to basic statistics.
This statistic is not included in your account.
Starter Account
The ideal entry-level account for individual users
- Instant access to 1m statistics
- Download in XLS, PDF & PNG format
- Detailed references
$59 USD $39 USD / Month *
in the first 12 months
Professional Account
Full access
Business Solutions including all features.
* Prices do not include sales tax.
Statistics on Hyperscale Computing
Overview
5
- Premium Statistic IT data center systems total spending worldwide 2012-2023
- Premium Statistic Global cloud IT infrastructure spending 2013-2026
- Premium Statistic Global public IT cloud services revenue 2016-2021, by segment
- Premium Statistic Spending on cloud and data centers 2009-2021, by segment
- Premium Statistic Global hyperscale operators capex 2016-2021, by quarter
Segment: Cloud
6
- Premium Statistic Vendor revenue from the public cloud services IaaS market worldwide 2015-2021
- Premium Statistic Global IaaS and PaaS hyperscaler revenue 2018-2021, by vendor
- Premium Statistic Global IaaS and PaaS hyperscaler market share 2020-2022, by vendor
- Premium Statistic Global hyperscaler cloud number of marketplace services 2021, by hyperscaler
- Premium Statistic Hyperscale cloud marketplace services used Europe and United States 2021, by category
- Premium Statistic China's cloud infrastructure service market Q4 2019-Q3 2022, by company
Segment: Data Center
4
- Basic Statistic Global colocation data center market revenue 2021-2028
- Premium Statistic Global figure of hyperscale data centers 2015-2021
- Premium Statistic Share of hyperscale data center locations worldwide in Q3 2021, by IT load capacity
- Premium Statistic Global market share of colocation data center revenue worldwide 2021, by vendor
Companies
7
- Premium Statistic Amazon Web Services: Annual revenue 2013-2022
- Basic Statistic Google Cloud revenue worldwide 2017-2022
- Basic Statistic IBM global revenue 2010-2022, by segment
- Premium Statistic Tencent revenue distribution 2015-2021, by segment
- Premium Statistic Revenue of Microsoft broken down by segment 2012-2022
- Basic Statistic Alibaba Cloud: Annual revenue 2018-2022
- Premium Statistic Baidu's cloud service revenue 2018-2021
Consumption
5
- Premium Statistic Cloud usage by organizations worldwide 2019-2022, by vendor
- Premium Statistic Global adoption and repatriation of cloud vendors 2022, by vendor
- Premium Statistic Global current and future IaaS provider choice 2020-2022, by provider
- Premium Statistic Expected change in technology investments worldwide 2022
- Premium Statistic Importance of no cloud vendor lock-in worldwide 2019-2022
Further related statistics
20
- Computer hardware software and peripherals market size in Singapore 2016-2018
- Computer hardware software and peripherals export value in Singapore 2016-2018
- Computer hardware, software, and peripherals import value in Singapore 2016-2018
- Computer hardware software and peripherals production value in Singapore 2016-2018
- IT hardware: global market forecast 2007-2015
- IT equipment revenue by region 2010
- Top states by midrange server spending in U.S. 2017
- Global traditional IT hardware/software/deploy & support services spending 2015-2026
- IT hardware spending forecast North America 2013-2020
- Top states by high-end server spending in U.S. 2016
- Number of statements about technology hardware brands in the Netherlands 2020
- Production value of IT hardware of Taiwan 2009-2014
- Leading vendors big data hardware revenue worldwide 2015-2017
- Materialise net profit worldwide 2017-2020, by quarter
- Middle East and Africa hardware spending forecast 2014-2020
- Materialise EBITDA worldwide 2017-2020, by quarter
- HPC revenue worldwide 2012-2021, by segment
- HPC market revenue 2011-2021, by economic sector
- Worldwide HPC storage revenue share 2016, by company
- Worldwide HPC open source applications' market share 2016
Further Content: You might find this interesting as well
Statistics
- Computer hardware software and peripherals market size in Singapore 2016-2018
- Computer hardware software and peripherals export value in Singapore 2016-2018
- Computer hardware, software, and peripherals import value in Singapore 2016-2018
- Computer hardware software and peripherals production value in Singapore 2016-2018
- IT hardware: global market forecast 2007-2015
- IT equipment revenue by region 2010
- Top states by midrange server spending in U.S. 2017
- Global traditional IT hardware/software/deploy & support services spending 2015-2026
- IT hardware spending forecast North America 2013-2020
- Top states by high-end server spending in U.S. 2016
- Number of statements about technology hardware brands in the Netherlands 2020
- Production value of IT hardware of Taiwan 2009-2014
- Leading vendors big data hardware revenue worldwide 2015-2017
- Materialise net profit worldwide 2017-2020, by quarter
- Middle East and Africa hardware spending forecast 2014-2020
- Materialise EBITDA worldwide 2017-2020, by quarter
- HPC revenue worldwide 2012-2021, by segment
- HPC market revenue 2011-2021, by economic sector
- Worldwide HPC storage revenue share 2016, by company
- Worldwide HPC open source applications' market share 2016
IMDA. (February 10, 2020). Market value of the hardware industry in Singapore from 2012 to 2018 (in billion Singapore dollars) [Graph]. In Statista. Retrieved March 25, 2023, from https://www.statista.com/statistics/1004762/singapore-hardware-revenue/
IMDA. "Market value of the hardware industry in Singapore from 2012 to 2018 (in billion Singapore dollars)." Chart. February 10, 2020. Statista. Accessed March 25, 2023. https://www.statista.com/statistics/1004762/singapore-hardware-revenue/
IMDA. (2020). Market value of the hardware industry in Singapore from 2012 to 2018 (in billion Singapore dollars). Statista. Statista Inc.. Accessed: March 25, 2023. https://www.statista.com/statistics/1004762/singapore-hardware-revenue/
IMDA. "Market Value of The Hardware Industry in Singapore from 2012 to 2018 (in Billion Singapore Dollars)." Statista, Statista Inc., 10 Feb 2020, https://www.statista.com/statistics/1004762/singapore-hardware-revenue/
IMDA, Market value of the hardware industry in Singapore from 2012 to 2018 (in billion Singapore dollars) Statista, https://www.statista.com/statistics/1004762/singapore-hardware-revenue/ (last visited March 25, 2023)
Market value of the hardware industry in Singapore from 2012 to 2018 (in billion Singapore dollars) [Graph], IMDA, February 10, 2020. [Online]. Available: https://www.statista.com/statistics/1004762/singapore-hardware-revenue/