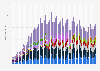
Manufacturers shipped a total of one million foldable smartphones in 2019, and forecasts show they are set to ship of eight million units in 2020. Foldable smartphone shipments in 2019 represented a small fraction of the 1.37 billion global smartphone shipments in that year. Entering the market in 2019, analysts expect foldable smartphone shipments to reach 50.1 million units globally by 2022.
Limited options in foldable smartphones
Compared to regular smartphones, there very few foldable options currently available in the smartphone market. Those that are available are selling at a much higher price than regular smartphones. In the United States for example, the few foldable smartphones available for purchase are selling at prices of up to 1,979 U.S. dollars. However, Microsoft, and the Chinese companies Oppo, and Xiaomi, are planning to release foldable smartphones, adding to the current available options from Samsung and Motorola.
Profit from the additional features of your individual account
Currently, you are using a shared account. To use individual functions (e.g., mark statistics as favourites, set
statistic alerts) please log in with your personal account.
If you are an admin, please authenticate by logging in again.
Learn more about how Statista can support your business.
Strategy Analytics. (February 10, 2020). Global foldable smartphone shipments in 2019, 2020 and 2025 (in million units) [Graph]. In Statista. Retrieved September 19, 2024, from https://www.statista.com/statistics/1101618/global-foldable-smartphone-shipments/
Strategy Analytics. "Global foldable smartphone shipments in 2019, 2020 and 2025 (in million units)." Chart. February 10, 2020. Statista. Accessed September 19, 2024. https://www.statista.com/statistics/1101618/global-foldable-smartphone-shipments/
Strategy Analytics. (2020). Global foldable smartphone shipments in 2019, 2020 and 2025 (in million units). Statista. Statista Inc.. Accessed: September 19, 2024. https://www.statista.com/statistics/1101618/global-foldable-smartphone-shipments/
Strategy Analytics. "Global Foldable Smartphone Shipments in 2019, 2020 and 2025 (in Million Units)." Statista, Statista Inc., 10 Feb 2020, https://www.statista.com/statistics/1101618/global-foldable-smartphone-shipments/
Strategy Analytics, Global foldable smartphone shipments in 2019, 2020 and 2025 (in million units) Statista, https://www.statista.com/statistics/1101618/global-foldable-smartphone-shipments/ (last visited September 19, 2024)
Global foldable smartphone shipments in 2019, 2020 and 2025 (in million units) [Graph], Strategy Analytics, February 10, 2020. [Online]. Available: https://www.statista.com/statistics/1101618/global-foldable-smartphone-shipments/