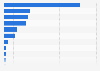
With 70.8 percent share, the Indian segment formed the largest market by revenue for Tata Consumer Products Limited in the financial year 2023. Tata Consumer Products Limited was formerly known as Tata Global Beverages Limited. However, the Tata Group company was renamed after it merged with Tata Chemicals Limited in February 2020. It was famous for tea, coffee, water, salt, pulses, spices, snacks, and nutria-supplements across India.
Revenue share of Tata Consumer Products Limited in financial year 2023, by region
Basic Account
Get to know the platform
You only have access to basic statistics.
This statistic is not included in your account.
Starter Account
The ideal entry-level account for individual users
- Instant access to 1m statistics
- Download in XLS, PDF & PNG format
- Detailed references
$149 USD / Month *
Professional Account
Full access
Business Solutions including all features.
* Prices do not include sales tax.
Other statistics that may interest you Tata Group
Overview
5
- Premium Statistic Leading 10 Indian brands 2023, by brand value
- Premium Statistic Leading companies in India 2022 by net profit
- Premium Statistic Passenger car market share India 2022, by vendor
- Premium Statistic Commercial vehicle market share India FY 2021-2023, by manufacturer
- Premium Statistic Market share of bus sales in India FY 2022, by manufacturer
Key figures
4
Retail and consumer goods
4
Automotive
3
Other key businesses
5
- Premium Statistic Tata Steel's net worth FY 2016-2023
- Basic Statistic Domestic market share of airlines across India FY 2022, by passengers carried
- Premium Statistic Key financial figures for Air India FY 2016-2022
- Premium Statistic Tata AIG's gross non-life insurance premiums FY 2002-2022
- Premium Statistic Number of hotels under IHCL in 2022, by brand
Further related statistics
19
- Tata Consumer Products' EBIT FY 2010-2023
- Tata Consumer Products' profit after tax FY 2015-2023
- Leading destinations of consumer goods exported from Turkey 2019
- Leading suppliers of consumer goods imported into Turkey 2019
- Consumer goods manufacturers with the highest advertising spendings in Germany 2014
- Leading personal consumer goods companies ranked by market value in Europe 2015
- Monthly export value of consumer goods in Canada 2015-2022
- FMCG market revenue in Russia 2008-2020
- Leading personal consumer goods companies ranked by market value in the UK 2015
- Per capita consumption of coffee and tea in Spain 2011-2021
- Share of occasions that include tea or coffee UK 2016, by time of day
- Change in share of occasions that include tea or coffee UK 2016, by time of day
- Per capita consumption of black and green tea in Germany 2005-2021
- Import value of coffee, tea and spices in Poland 2007-2021
- Hot beverage consumption by type in the United Kingdom (UK) 2015
- Volume of pulses production in Gujarat India FY 2009-2021
- Import value of kidney and white pea beans to EU-28 2009-2013
- Export of dry beans from the U.S. 2012-2020
- Gross value added from moong in India FY 2012-2020
Further Content: You might find this interesting as well
Statistics
- Tata Consumer Products' EBIT FY 2010-2023
- Tata Consumer Products' profit after tax FY 2015-2023
- Leading destinations of consumer goods exported from Turkey 2019
- Leading suppliers of consumer goods imported into Turkey 2019
- Consumer goods manufacturers with the highest advertising spendings in Germany 2014
- Leading personal consumer goods companies ranked by market value in Europe 2015
- Monthly export value of consumer goods in Canada 2015-2022
- FMCG market revenue in Russia 2008-2020
- Leading personal consumer goods companies ranked by market value in the UK 2015
- Per capita consumption of coffee and tea in Spain 2011-2021
- Share of occasions that include tea or coffee UK 2016, by time of day
- Change in share of occasions that include tea or coffee UK 2016, by time of day
- Per capita consumption of black and green tea in Germany 2005-2021
- Import value of coffee, tea and spices in Poland 2007-2021
- Hot beverage consumption by type in the United Kingdom (UK) 2015
- Volume of pulses production in Gujarat India FY 2009-2021
- Import value of kidney and white pea beans to EU-28 2009-2013
- Export of dry beans from the U.S. 2012-2020
- Gross value added from moong in India FY 2012-2020
Tata Consumer Products Limited. (May 12, 2023). Revenue share of Tata Consumer Products Limited in financial year 2023, by region [Graph]. In Statista. Retrieved December 03, 2023, from https://www.statista.com/statistics/1112821/tata-consumer-products-revenue-share-by-geographic-segment/
Tata Consumer Products Limited. "Revenue share of Tata Consumer Products Limited in financial year 2023, by region." Chart. May 12, 2023. Statista. Accessed December 03, 2023. https://www.statista.com/statistics/1112821/tata-consumer-products-revenue-share-by-geographic-segment/
Tata Consumer Products Limited. (2023). Revenue share of Tata Consumer Products Limited in financial year 2023, by region. Statista. Statista Inc.. Accessed: December 03, 2023. https://www.statista.com/statistics/1112821/tata-consumer-products-revenue-share-by-geographic-segment/
Tata Consumer Products Limited. "Revenue Share of Tata Consumer Products Limited in Financial Year 2023, by Region." Statista, Statista Inc., 12 May 2023, https://www.statista.com/statistics/1112821/tata-consumer-products-revenue-share-by-geographic-segment/
Tata Consumer Products Limited, Revenue share of Tata Consumer Products Limited in financial year 2023, by region Statista, https://www.statista.com/statistics/1112821/tata-consumer-products-revenue-share-by-geographic-segment/ (last visited December 03, 2023)
Revenue share of Tata Consumer Products Limited in financial year 2023, by region [Graph], Tata Consumer Products Limited, May 12, 2023. [Online]. Available: https://www.statista.com/statistics/1112821/tata-consumer-products-revenue-share-by-geographic-segment/