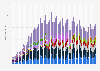
This graph shows the smartphone shipment volume worldwide by region from 2014 to 2020. In 2016, 467 million smartphones were shipped in the People's Republic of China.
Smartphone shipments worldwide from 2014 to 2020, by region
(in million units)
Characteristic
PRC
Rest of Asia/Pacific
EMEA
North America
Latin America
India
-
-
-
-
-
-
-
-
-
-
-
-
-
-
-
-
-
-
-
-
-
-
-
-
-
-
-
-
-
-
-
-
-
-
-
-
-
-
-
-
-
-
-
-
-
-
-
-
-
Exclusive Premium Statistic
To access all Premium Statistics, you need a paid Statista Account
Profit from the additional features of your individual account
Currently, you are using a shared account. To use individual functions (e.g., mark statistics as favourites, set
statistic alerts) please log in with your personal account.
If you are an admin, please authenticate by logging in again.
Learn more about how Statista can support your business.
Morgan Stanley. (September 11, 2017). Smartphone shipments worldwide from 2014 to 2020, by region (in million units) [Graph]. In Statista. Retrieved July 27, 2024, from https://www.statista.com/statistics/283331/smartphone-shipments-worldwide/
Morgan Stanley. "Smartphone shipments worldwide from 2014 to 2020, by region (in million units)." Chart. September 11, 2017. Statista. Accessed July 27, 2024. https://www.statista.com/statistics/283331/smartphone-shipments-worldwide/
Morgan Stanley. (2017). Smartphone shipments worldwide from 2014 to 2020, by region (in million units). Statista. Statista Inc.. Accessed: July 27, 2024. https://www.statista.com/statistics/283331/smartphone-shipments-worldwide/
Morgan Stanley. "Smartphone Shipments Worldwide from 2014 to 2020, by Region (in Million Units)." Statista, Statista Inc., 11 Sep 2017, https://www.statista.com/statistics/283331/smartphone-shipments-worldwide/
Morgan Stanley, Smartphone shipments worldwide from 2014 to 2020, by region (in million units) Statista, https://www.statista.com/statistics/283331/smartphone-shipments-worldwide/ (last visited July 27, 2024)
Smartphone shipments worldwide from 2014 to 2020, by region (in million units) [Graph], Morgan Stanley, September 11, 2017. [Online]. Available: https://www.statista.com/statistics/283331/smartphone-shipments-worldwide/