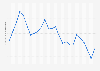
average price of around 69.72 U.S. dollars per barrel that year. OPEC stands for the Organization of the Petroleum Exporting Countries and was established in Iraq in 1960.
OPEC produced approximately 37.9 percent of the world’s total crude oil in 2021. OPEC's crude oil was sold for an OPEC's share of total global crude oil production from 2010 to 2021
Basic Account
Get to know the platform
You only have access to basic statistics.
This statistic is not included in your account.
Starter Account
The ideal entry-level account for individual users
- Instant access to 1m statistics
- Download in XLS, PDF & PNG format
- Detailed references
$59 USD $39 USD / Month *
in the first 12 months
Professional Account
Full access
Corporate solution including all features.
* Prices do not include sales tax.
Statistics on OPEC
Overview
5
Reserves
4
Production and refinery
6
- Premium Statistic Oil production in OPEC countries 1998-2021
- Premium Statistic OPEC 's share of total global crude oil production 2010-2021
- Basic Statistic Natural gas production in OPEC countries 2012-2021
- Basic Statistic OPEC's share of total global natural gas production 2010-2021
- Basic Statistic OPEC refinery capacity 2010-2021
- Premium Statistic Refinery capacities of OPEC countries 2012-2021
Prices
4
Trade
5
- Premium Statistic OPEC's net oil export revenue 2005-2021
- Premium Statistic OPEC net oil export revenue streams by country 2020
- Premium Statistic Global crude oil exports by OPEC countries 2012-2021
- Premium Statistic Oil exports from OPEC regions 2021
- Basic Statistic OPEC oil exports by regions of destination 2012-2021
Selected country profiles
8
- Premium Statistic Algeria's fossil fuels industry select information 2020
- Premium Statistic Angola's fossil fuels industry selected figures 2020
- Premium Statistic Equatorial Guinea's fossil fuels industry selected figures 2020
- Premium Statistic Gabon's fossil fuels industry selected figures 2020
- Premium Statistic Iran's fossil fuels industry select information 2020
- Premium Statistic Iraq's fossil fuels industry select information 2020
- Basic Statistic Kuwait's fossil fuels industry selected figures 2020
- Basic Statistic Libya's fossil fuels industry select information 2020
Further related statistics
18
- Leading oil producing countries 2020
- Global oil production share 2021, by country
- Oil production in the European Union 2000-2021
- Share of oil and gas production in Russia in 2018, by region
- Ecopetrol: crude oil production share 2020, by type
- Ecopetrol: crude oil production 2016-2020, by type
- Refinery feedstock volume of crude oil in Finland 2007-2017
- Liquid hydrocarbons production by Rosneft 2016-2020
- Crude oil production in Angola, by operator 2018
- Proved oil reserves in Norway 1990-2020
- Middle East crude oil reserves by selected country 2015
- Oil production in Argentina 2009-2021
- Proved crude oil reserves in the U.S. 1990-2020
- Global years of remaining global oil supply by region 2020
- Cargo transported through the Suez Canal yearly 2015-2019, by selected cargo type
- Baker Hughes' revenue 2007-2021
- Argentina: soybean oil production volume 2010-2018
- Change in industrial production index of oil and gas in Algeria 2010-2020
Further Content: You might find this interesting as well
Statistics
- Leading oil producing countries 2020
- Global oil production share 2021, by country
- Oil production in the European Union 2000-2021
- Share of oil and gas production in Russia in 2018, by region
- Ecopetrol: crude oil production share 2020, by type
- Ecopetrol: crude oil production 2016-2020, by type
- Refinery feedstock volume of crude oil in Finland 2007-2017
- Liquid hydrocarbons production by Rosneft 2016-2020
- Crude oil production in Angola, by operator 2018
- Proved oil reserves in Norway 1990-2020
- Middle East crude oil reserves by selected country 2015
- Oil production in Argentina 2009-2021
- Proved crude oil reserves in the U.S. 1990-2020
- Global years of remaining global oil supply by region 2020
- Cargo transported through the Suez Canal yearly 2015-2019, by selected cargo type
- Baker Hughes' revenue 2007-2021
- Argentina: soybean oil production volume 2010-2018
- Change in industrial production index of oil and gas in Algeria 2010-2020
Topics

OPEC. (June 23, 2022). OPEC's share of total global crude oil production from 2010 to 2021 [Graph]. In Statista. Retrieved February 07, 2023, from https://www.statista.com/statistics/292590/global-crude-oil-production-opec-share/
OPEC. "OPEC's share of total global crude oil production from 2010 to 2021." Chart. June 23, 2022. Statista. Accessed February 07, 2023. https://www.statista.com/statistics/292590/global-crude-oil-production-opec-share/
OPEC. (2022). OPEC's share of total global crude oil production from 2010 to 2021. Statista. Statista Inc.. Accessed: February 07, 2023. https://www.statista.com/statistics/292590/global-crude-oil-production-opec-share/
OPEC. "Opec's Share of Total Global Crude Oil Production from 2010 to 2021." Statista, Statista Inc., 23 Jun 2022, https://www.statista.com/statistics/292590/global-crude-oil-production-opec-share/
OPEC, OPEC's share of total global crude oil production from 2010 to 2021 Statista, https://www.statista.com/statistics/292590/global-crude-oil-production-opec-share/ (last visited February 07, 2023)
OPEC's share of total global crude oil production from 2010 to 2021 [Graph], OPEC, June 23, 2022. [Online]. Available: https://www.statista.com/statistics/292590/global-crude-oil-production-opec-share/