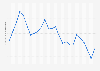
Iran has been the leading OPEC country in terms of natural gas production output.
OPEC's share of the total global natural gas production has remained relatively stable since 2010, standing at 16.2 percent 2021. Since 2012, OPEC's share of total global natural gas production from 2010 to 2021
Loading statistic...
Basic Account
Get to know the platform
You only have access to basic statistics.
Starter Account
The ideal entry-level account for individual users
- Instant access to 1m statistics
- Download in XLS, PDF & PNG format
- Detailed references
$59 USD $39 USD / Month *
in the first 12 months
Professional Account
Full access
Business Solutions including all features.
* Prices do not include sales tax.
Statistics on OPEC
Overview
5
Reserves
4
Production and refinery
6
- Premium Statistic Oil production in OPEC countries 1998-2021
- Premium Statistic OPEC 's share of total global crude oil production 2010-2021
- Basic Statistic Natural gas production in OPEC countries 2012-2021
- Basic Statistic OPEC's share of total global natural gas production 2010-2021
- Basic Statistic OPEC refinery capacity 2010-2021
- Premium Statistic Refinery capacities of OPEC countries 2012-2021
Prices
4
Trade
5
- Premium Statistic OPEC's net oil export revenue 2005-2023
- Premium Statistic OPEC net oil export revenue streams by country 2022
- Premium Statistic Global crude oil exports by OPEC countries 2012-2021
- Premium Statistic Oil exports from OPEC regions 2021
- Basic Statistic OPEC oil exports by regions of destination 2012-2021
Selected country profiles
8
- Premium Statistic Algeria's fossil fuels industry select information 2020
- Premium Statistic Angola's fossil fuels industry selected figures 2020
- Premium Statistic Equatorial Guinea's fossil fuels industry selected figures 2020
- Premium Statistic Gabon's fossil fuels industry selected figures 2020
- Premium Statistic Iran's fossil fuels industry select information 2020
- Premium Statistic Iraq's fossil fuels industry select information 2020
- Basic Statistic Kuwait's fossil fuels industry selected figures 2020
- Basic Statistic Libya's fossil fuels industry select information 2020
Further related statistics
15
- Italy: number of offshore natural gas producing wells 2012-2021
- Natural gas production in Europe and CIS 1998-2020
- Monthly natural gas production in Mexico 2019-2022
- ConocoPhillips' U.S. natural gas production 2016-2021
- Natural gas production in the European Union 1998-2021
- ExxonMobil's U.S. natural gas production 2010-2021
- Production increase of natural gas worldwide by region, 2019 compared to 2018
- Natural gas production in Denmark 2005-2021
- PetroChina's natural gas production 2010-2021
- Natural gas production in Norway 2005-2021
- Global shale gas production by select country 2015-2040
- Gas wells completed in Canada 1955-2019
- Nigeria's planned natural gas projects 2016
- Global export share of leading natural gas exporters 2019
- Global natural gas discoveries 2011-2018
Further Content: You might find this interesting as well
Statistics
- Italy: number of offshore natural gas producing wells 2012-2021
- Natural gas production in Europe and CIS 1998-2020
- Monthly natural gas production in Mexico 2019-2022
- ConocoPhillips' U.S. natural gas production 2016-2021
- Natural gas production in the European Union 1998-2021
- ExxonMobil's U.S. natural gas production 2010-2021
- Production increase of natural gas worldwide by region, 2019 compared to 2018
- Natural gas production in Denmark 2005-2021
- PetroChina's natural gas production 2010-2021
- Natural gas production in Norway 2005-2021
- Global shale gas production by select country 2015-2040
- Gas wells completed in Canada 1955-2019
- Nigeria's planned natural gas projects 2016
- Global export share of leading natural gas exporters 2019
- Global natural gas discoveries 2011-2018
Topics

OPEC. (June 23, 2022). OPEC's share of total global natural gas production from 2010 to 2021 [Graph]. In Statista. Retrieved March 23, 2023, from https://www.statista.com/statistics/292591/global-natural-gas-production-opec-share/
OPEC. "OPEC's share of total global natural gas production from 2010 to 2021." Chart. June 23, 2022. Statista. Accessed March 23, 2023. https://www.statista.com/statistics/292591/global-natural-gas-production-opec-share/
OPEC. (2022). OPEC's share of total global natural gas production from 2010 to 2021. Statista. Statista Inc.. Accessed: March 23, 2023. https://www.statista.com/statistics/292591/global-natural-gas-production-opec-share/
OPEC. "Opec's Share of Total Global Natural Gas Production from 2010 to 2021." Statista, Statista Inc., 23 Jun 2022, https://www.statista.com/statistics/292591/global-natural-gas-production-opec-share/
OPEC, OPEC's share of total global natural gas production from 2010 to 2021 Statista, https://www.statista.com/statistics/292591/global-natural-gas-production-opec-share/ (last visited March 23, 2023)
OPEC's share of total global natural gas production from 2010 to 2021 [Graph], OPEC, June 23, 2022. [Online]. Available: https://www.statista.com/statistics/292591/global-natural-gas-production-opec-share/