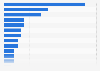
In the 2023 season, roughly 44 percent of the revenue generated in the NHL was through seating and suites. Meanwhile, national revenue made up approximately one fifth of the revenue generated by the league in that season.
Share of revenue in the NHL in North America in 2023, by type
Profit from the additional features of your individual account
Currently, you are using a shared account. To use individual functions (e.g., mark statistics as favourites, set
statistic alerts) please log in with your personal account.
If you are an admin, please authenticate by logging in again.
Learn more about how Statista can support your business.
Sportico. (February 16, 2024). Share of revenue in the NHL in North America in 2023, by type [Graph]. In Statista. Retrieved October 26, 2024, from https://www.statista.com/statistics/1459401/nhl-revenue-by-type/
Sportico. "Share of revenue in the NHL in North America in 2023, by type." Chart. February 16, 2024. Statista. Accessed October 26, 2024. https://www.statista.com/statistics/1459401/nhl-revenue-by-type/
Sportico. (2024). Share of revenue in the NHL in North America in 2023, by type. Statista. Statista Inc.. Accessed: October 26, 2024. https://www.statista.com/statistics/1459401/nhl-revenue-by-type/
Sportico. "Share of Revenue in The Nhl in North America in 2023, by Type." Statista, Statista Inc., 16 Feb 2024, https://www.statista.com/statistics/1459401/nhl-revenue-by-type/
Sportico, Share of revenue in the NHL in North America in 2023, by type Statista, https://www.statista.com/statistics/1459401/nhl-revenue-by-type/ (last visited October 26, 2024)
Share of revenue in the NHL in North America in 2023, by type [Graph], Sportico, February 16, 2024. [Online]. Available: https://www.statista.com/statistics/1459401/nhl-revenue-by-type/