community money pledged that quarter was 138.92 million U.S. dollars.
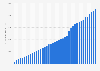
This statistic shows the daily amount of dollars pledged for project funding on Kickstarter as of the third quarter of 2014. During this period of time, 1.51 million U.S. dollars were pledged to projects on the crowdfunding platform every day. Overall, 6,124 projects reached their funding goal during the quarter. The amount of Amount of funding pledged to Kickstarter projects per day from 1st quarter to 3rd quarter 2014 (in million U.S. dollars)
Basic Account
Get to know the platform
You only have access to basic statistics.
This statistic is not included in your account.
Starter Account
The ideal entry-level account for individual users
- Instant access to 1m statistics
- Download in XLS, PDF & PNG format
- Detailed references
$149 USD / Month *
Professional Account
Full access
Business Solutions including all features.
* Prices do not include sales tax.
Other statistics that may interest you Statistics on
About the industry
10
- Basic Statistic Kickstarter: amount of funding pledged as of 3rd quarter 2014
- Premium Statistic Amount of funding pledged on Kickstarter by project category 2023
- Premium Statistic Total amount of funding pledged on Kickstarter 2012-2023
- Premium Statistic Kickstarter project funding success rate November 2023
- Basic Statistic Distribution of Kickstarter funding amounts raised 2023
- Premium Statistic Number of Kickstarter.com project backers in 2012, per category
- Basic Statistic Number of total and repeat project backers on Kickstarter 2014-2023
- Premium Statistic Most funded Kickstarter projects 2023
- Premium Statistic Project launches on Kickstarter based on amount raised on first day 2011-2015
- Basic Statistic Kickstarter: fastest projects to reach 1 million U.S. dollars 2016
About the region
10
- Premium Statistic Number of successful projects per category on Kickstarter 2023
- Basic Statistic Top Kickstarter projects sorted by funding as of March 2015
- Premium Statistic Most-backed projects on Kickstarter 2023
- Premium Statistic Runway of female-founded startups worldwide 2020
- Basic Statistic Amazon Web Services: quarterly revenue 2014-2023
- Basic Statistic Amazon Web Services: quarterly TTM revenue 2014-2023
- Basic Statistic Amazon Web Services: year-on-year growth 2014-2023
- Premium Statistic AI funding worldwide 2011-2023, by quarter
- Premium Statistic Cities with the highest number of unicorn companies globally 2022
- Premium Statistic VTEX : quarterly GMV 2020-2023
Other regions
10
- Basic Statistic Brazil: total funding of leading startups 2023
- Premium Statistic PE/VC start-up financing in India by sector 2021
- Basic Statistic Leading startups based on funding in Australia 2020
- Basic Statistic The same day-delivery market in the U.S. - share by service type 2018
- Premium Statistic Leading Israeli-founded unicorn startups based on market valuation 2019
- Premium Statistic Value of first time venture capital funding deals in Europe 2014-2022
- Premium Statistic Distribution of startup deals Thailand 2019, by industry
- Premium Statistic Startup funding in the Nordic countries 2016 by country
- Premium Statistic Startup funding development in the Nordic countries 2016 by country
- Premium Statistic Leading startup companies in Sweden 2017, by funding
Related statistics
10
- Premium Statistic Most-funded UK projects on Kickstarter 2023, by amount pledged
- Premium Statistic Value of venture capital investments into fintech startups in Germany 2020, by city
- Premium Statistic Mexico: fintech distribution 2019, by funds raised
- Premium Statistic Most funded UK projects on Kickstarter as of 2014, by number of backers
- Premium Statistic Latin America: funding of fintech companies 2023
- Premium Statistic Number of fintech startups founded in Germany 2015-2022
- Premium Statistic Leading fintech startups by funding Peru 2022
- Premium Statistic Peru: key figures on Yape 2022
- Basic Statistic Successful dollars pledged towards video games on Kickstarter 2011-2021
- Premium Statistic Successful dollars pledged towards games on Kickstarter 2012-2021
Further related statistics
6
- Magazine publishing revenue in Western Europe 2009-2016, B2B and B2C
- Magazine publishing revenue in Central & Eastern Europe 2009-2016, by B2B and B2C
- Global sales share of Monster Beverage by distribution channel 2010-2022
- Paid ad methods used for B2C content marketing North America 2022
- Forecast: global data center IP traffic 2013-2021, by segment
- Diamond project pipeline worldwide by yearly average production 2016-2020
Further Content: You might find this interesting as well
Statistics
- Magazine publishing revenue in Western Europe 2009-2016, B2B and B2C
- Magazine publishing revenue in Central & Eastern Europe 2009-2016, by B2B and B2C
- Global sales share of Monster Beverage by distribution channel 2010-2022
- Paid ad methods used for B2C content marketing North America 2022
- Forecast: global data center IP traffic 2013-2021, by segment
- Diamond project pipeline worldwide by yearly average production 2016-2020
Kickstarter. (October 9, 2014). Amount of funding pledged to Kickstarter projects per day from 1st quarter to 3rd quarter 2014 (in million U.S. dollars) [Graph]. In Statista. Retrieved December 11, 2023, from https://www.statista.com/statistics/310199/amount-of-dollars-pledged-per-daily-quarterly-on-kickstarter/
Kickstarter. "Amount of funding pledged to Kickstarter projects per day from 1st quarter to 3rd quarter 2014 (in million U.S. dollars)." Chart. October 9, 2014. Statista. Accessed December 11, 2023. https://www.statista.com/statistics/310199/amount-of-dollars-pledged-per-daily-quarterly-on-kickstarter/
Kickstarter. (2014). Amount of funding pledged to Kickstarter projects per day from 1st quarter to 3rd quarter 2014 (in million U.S. dollars). Statista. Statista Inc.. Accessed: December 11, 2023. https://www.statista.com/statistics/310199/amount-of-dollars-pledged-per-daily-quarterly-on-kickstarter/
Kickstarter. "Amount of Funding Pledged to Kickstarter Projects per Day from 1st Quarter to 3rd Quarter 2014 (in Million U.S. Dollars)." Statista, Statista Inc., 9 Oct 2014, https://www.statista.com/statistics/310199/amount-of-dollars-pledged-per-daily-quarterly-on-kickstarter/
Kickstarter, Amount of funding pledged to Kickstarter projects per day from 1st quarter to 3rd quarter 2014 (in million U.S. dollars) Statista, https://www.statista.com/statistics/310199/amount-of-dollars-pledged-per-daily-quarterly-on-kickstarter/ (last visited December 11, 2023)
Amount of funding pledged to Kickstarter projects per day from 1st quarter to 3rd quarter 2014 (in million U.S. dollars) [Graph], Kickstarter, October 9, 2014. [Online]. Available: https://www.statista.com/statistics/310199/amount-of-dollars-pledged-per-daily-quarterly-on-kickstarter/