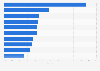
This statistic illustrates component makers' and OEMs' five-year total shareholder returns (TSR) worldwide between 2009 and 2013. The component maker sector produced a five-year median annual TSR of 33 percent.
Component makers' and OEMs' total shareholder returns (TSR) worldwide between 2009 and 2013
Profit from the additional features of your individual account
Currently, you are using a shared account. To use individual functions (e.g., mark statistics as favourites, set
statistic alerts) please log in with your personal account.
If you are an admin, please authenticate by logging in again.
Learn more about how Statista can support your business.
BCG. (August 30, 2014). Component makers' and OEMs' total shareholder returns (TSR) worldwide between 2009 and 2013 [Graph]. In Statista. Retrieved September 19, 2024, from https://www.statista.com/statistics/378396/total-shareholder-returns-of-component-makers-and-oems/
BCG. "Component makers' and OEMs' total shareholder returns (TSR) worldwide between 2009 and 2013." Chart. August 30, 2014. Statista. Accessed September 19, 2024. https://www.statista.com/statistics/378396/total-shareholder-returns-of-component-makers-and-oems/
BCG. (2014). Component makers' and OEMs' total shareholder returns (TSR) worldwide between 2009 and 2013. Statista. Statista Inc.. Accessed: September 19, 2024. https://www.statista.com/statistics/378396/total-shareholder-returns-of-component-makers-and-oems/
BCG. "Component Makers' and Oems' Total Shareholder Returns (Tsr) Worldwide between 2009 and 2013." Statista, Statista Inc., 30 Aug 2014, https://www.statista.com/statistics/378396/total-shareholder-returns-of-component-makers-and-oems/
BCG, Component makers' and OEMs' total shareholder returns (TSR) worldwide between 2009 and 2013 Statista, https://www.statista.com/statistics/378396/total-shareholder-returns-of-component-makers-and-oems/ (last visited September 19, 2024)
Component makers' and OEMs' total shareholder returns (TSR) worldwide between 2009 and 2013 [Graph], BCG, August 30, 2014. [Online]. Available: https://www.statista.com/statistics/378396/total-shareholder-returns-of-component-makers-and-oems/