coronavirus outbreak in the United States.
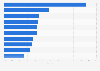
As of October 2020, North American auto demand was around 2.5 million units below 2019 levels. In terms of production in North America's largest market, output in the U.S. automotive industry was roughly 4,300 units in April 2020. U.S. plants reopened after a nine-week shutdown amid the Estimated reduction in auto demand following the coronavirus pandemic as of October 2020, by key market (in million vehicles)
Loading statistic...
Basic Account
Get to know the platform
You only have access to basic statistics.
Starter Account
The ideal entry-level account for individual users
- Instant access to 1m statistics
- Download in XLS, PDF & PNG format
- Detailed references
$59 USD $39 USD / Month *
in the first 12 months
Professional Account
Full access
Business Solutions including all features.
* Prices do not include sales tax.
Statistics on Hyundai Motor Company
Overview
4
- Premium Statistic Forbes ranking of ten largest public companies South Korea 2022
- Premium Statistic Car brand market share worldwide 2022
- Premium Statistic Leading automobile company market share South Korea 2022
- Premium Statistic Hyundai Motor Company's subsidiaries South Korea 2020, by business segment
Financial figures
4
Domestic sales
5
- Premium Statistic Hyundai Motor's sales revenue 2022, by segment
- Premium Statistic Hyundai Motor's sales revenue from recreational vehicles 2015-2021
- Premium Statistic Hyundai Motor's sales revenue from passenger cars 2015-2021
- Premium Statistic Hyundai Motor's sales revenue from small commercial vehicles 2015-2021
- Premium Statistic Hyundai Motor's sales revenue from large commercial vehicles 2015-2021
Overseas sales
5
- Premium Statistic Hyundai Motor's overseas sales 2021, by region
- Premium Statistic Hyundai Motor's unit sales North America 2016-2021
- Premium Statistic Hyundai Motor's unit sales Europe 2016-2021
- Premium Statistic Hyundai Motor's unit sales India 2016-2021
- Premium Statistic Hyundai Motor's unit sales China 2016-2021
Production facilities
5
- Premium Statistic Hyundai Motor's production volume South Korea 2021, by factory
- Premium Statistic Hyundai Motor's production volume overseas 2021, by factory
- Premium Statistic Hyundai Motor's production volume Ulsan South Korea 2015-2021
- Premium Statistic Hyundai Motor's production volume India 2015-2021
- Premium Statistic Hyundai Motor's production volume China 2015-2021
Alternative fuel
5
- Premium Statistic Most sold electric vehicle models South Korea 2022
- Premium Statistic Sales volume of Hyundai Kona Electric South Korea 2018-2021
- Premium Statistic Sales volume of Hyundai Ioniq Electric South Korea 2016-2021
- Basic Statistic Hyundai Motor Group's target FCEV investments 2020-2030
- Basic Statistic Hyundai Motor Group's target FCEV production volume 2020-2030
Further related statistics
15
- ADAS ultrasonic wave components - global market size 2014-2020
- Size of the global 3D terrestrial laser scanning market 2014/2023
- Automotive sales volume in China 2009-2017
- Automotive sales growth rate in China 2010-2017
- Automotive interior market size worldwide 2019-2030
- Global market for automotive radars 2015/2021
- Global sales of automotive cameras and modules 2015/ 2020
- Global sales of LiDAR system sensors 2014/2022
- Global automotive exterior market size 2014-2020
- Global driver assistance system component market size 2014-2020
- GM's North American automotive revenue per vehicle 2006-2012
- Financing event number in car aftermarket online service in China 2017, by segment
- Breakdown of India's automotive component market by segment 2015
- Automotive drivers' growth rate in China 2009-2017
- Industry revenue of “automotive body, paint and interior repair“ in Florida 2012-2024
Further Content: You might find this interesting as well
Statistics
- ADAS ultrasonic wave components - global market size 2014-2020
- Size of the global 3D terrestrial laser scanning market 2014/2023
- Automotive sales volume in China 2009-2017
- Automotive sales growth rate in China 2010-2017
- Automotive interior market size worldwide 2019-2030
- Global market for automotive radars 2015/2021
- Global sales of automotive cameras and modules 2015/ 2020
- Global sales of LiDAR system sensors 2014/2022
- Global automotive exterior market size 2014-2020
- Global driver assistance system component market size 2014-2020
- GM's North American automotive revenue per vehicle 2006-2012
- Financing event number in car aftermarket online service in China 2017, by segment
- Breakdown of India's automotive component market by segment 2015
- Automotive drivers' growth rate in China 2009-2017
- Industry revenue of “automotive body, paint and interior repair“ in Florida 2012-2024
PwC. (November 11, 2020). Estimated reduction in auto demand following the coronavirus pandemic as of October 2020, by key market (in million vehicles) [Graph]. In Statista. Retrieved March 25, 2023, from https://www.statista.com/statistics/379770/vehicles-lost-due-to-auto-plant-stoppages-in-selected-regions/
PwC. "Estimated reduction in auto demand following the coronavirus pandemic as of October 2020, by key market (in million vehicles)." Chart. November 11, 2020. Statista. Accessed March 25, 2023. https://www.statista.com/statistics/379770/vehicles-lost-due-to-auto-plant-stoppages-in-selected-regions/
PwC. (2020). Estimated reduction in auto demand following the coronavirus pandemic as of October 2020, by key market (in million vehicles). Statista. Statista Inc.. Accessed: March 25, 2023. https://www.statista.com/statistics/379770/vehicles-lost-due-to-auto-plant-stoppages-in-selected-regions/
PwC. "Estimated Reduction in Auto Demand following The Coronavirus Pandemic as of October 2020, by Key Market (in Million Vehicles)." Statista, Statista Inc., 11 Nov 2020, https://www.statista.com/statistics/379770/vehicles-lost-due-to-auto-plant-stoppages-in-selected-regions/
PwC, Estimated reduction in auto demand following the coronavirus pandemic as of October 2020, by key market (in million vehicles) Statista, https://www.statista.com/statistics/379770/vehicles-lost-due-to-auto-plant-stoppages-in-selected-regions/ (last visited March 25, 2023)
Estimated reduction in auto demand following the coronavirus pandemic as of October 2020, by key market (in million vehicles) [Graph], PwC, November 11, 2020. [Online]. Available: https://www.statista.com/statistics/379770/vehicles-lost-due-to-auto-plant-stoppages-in-selected-regions/