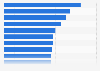
This statistic presents information on the advertising spending as percent of sales in the amusement parks industry in the United States from 2011 to 2014, and provides an estimate for 2015. According to the source's calculations, in 2012, ad to sales ratio for the industry amounted to five percent.
Advertising spending as percent of sales in the amusement parks industry in the United States from 2011 to 2015
Basic Account
Get to know the platform
You only have access to basic statistics.
This statistic is not included in your account.
Starter Account
The ideal entry-level account for individual users
- Instant access to 1m statistics
- Download in XLS, PDF & PNG format
- Detailed references
$59 USD $39 USD / Month *
in the first 12 months
Professional Account
Full access
Corporate solution including all features.
* Prices do not include sales tax.
Statistics on Amusement and theme parks
Attendance
6
- Premium Statistic Top amusement park chains worldwide by visitation 2019
- Basic Statistic Most visited amusement and theme parks worldwide 2019-2021
- Premium Statistic Most visited amusement and theme parks in North America 2021
- Premium Statistic Most visited amusement and theme parks in Europe 2019-2021
- Basic Statistic Most visited amusement and theme parks APAC 2019-2021
- Premium Statistic Most visited Latin American amusement and theme parks 2019-2021
Revenue of industry leaders
6
- Basic Statistic Revenue of the Walt Disney Company in 2022, by operating segment
- Premium Statistic Merlin Entertainments revenue 2010-2021
- Premium Statistic Legoland revenue worldwide 2011-2021
- Premium Statistic SeaWorld revenue 2010-2021
- Premium Statistic Revenue of Six Flags Entertainment in North America 2010-2021
- Premium Statistic Revenue of Cedar Fair Entertainment in North America 2010-2021
Waterparks
4
Roller coasters
4
Further related statistics
11
- U.S. amusement parks industry ad spend 2018-2020
- Ranking of sport, amusement, and recreation companies in Denmark 2020, by turnover
- Ranking of sport, amusement, and recreation companies in Norway 2022, by turnover
- Number of amusement and theme parks in the Netherlands 1998-2008
- Industry revenue of “amusement and theme parks“ in the U.S. 2012-2024
- Forecast: revenue amusement and theme parks US 2008-2020
- Ranking of sport, amusement, and recreation companies in Sweden 2020, by turnover
- Operating revenue of amusement parks and arcades in Canada 2012-2018
- Merlin Entertainments revenue growth 2012-2021
- Tivoli: annual revenue 2009-2021
- Industry revenue of “amusement parks and arcades“ in Ohio 2012-2024
Further Content: You might find this interesting as well
Statistics
- U.S. amusement parks industry ad spend 2018-2020
- Ranking of sport, amusement, and recreation companies in Denmark 2020, by turnover
- Ranking of sport, amusement, and recreation companies in Norway 2022, by turnover
- Number of amusement and theme parks in the Netherlands 1998-2008
- Industry revenue of “amusement and theme parks“ in the U.S. 2012-2024
- Forecast: revenue amusement and theme parks US 2008-2020
- Ranking of sport, amusement, and recreation companies in Sweden 2020, by turnover
- Operating revenue of amusement parks and arcades in Canada 2012-2018
- Merlin Entertainments revenue growth 2012-2021
- Tivoli: annual revenue 2009-2021
- Industry revenue of “amusement parks and arcades“ in Ohio 2012-2024
Schonfeld & Associates. (June 15, 2015). Advertising spending as percent of sales in the amusement parks industry in the United States from 2011 to 2015 [Graph]. In Statista. Retrieved January 28, 2023, from https://www.statista.com/statistics/471200/ad-spend-to-sales-amusement-parks-usa/
Schonfeld & Associates. "Advertising spending as percent of sales in the amusement parks industry in the United States from 2011 to 2015." Chart. June 15, 2015. Statista. Accessed January 28, 2023. https://www.statista.com/statistics/471200/ad-spend-to-sales-amusement-parks-usa/
Schonfeld & Associates. (2015). Advertising spending as percent of sales in the amusement parks industry in the United States from 2011 to 2015. Statista. Statista Inc.. Accessed: January 28, 2023. https://www.statista.com/statistics/471200/ad-spend-to-sales-amusement-parks-usa/
Schonfeld & Associates. "Advertising Spending as Percent of Sales in The Amusement Parks Industry in The United States from 2011 to 2015." Statista, Statista Inc., 15 Jun 2015, https://www.statista.com/statistics/471200/ad-spend-to-sales-amusement-parks-usa/
Schonfeld & Associates, Advertising spending as percent of sales in the amusement parks industry in the United States from 2011 to 2015 Statista, https://www.statista.com/statistics/471200/ad-spend-to-sales-amusement-parks-usa/ (last visited January 28, 2023)
Advertising spending as percent of sales in the amusement parks industry in the United States from 2011 to 2015 [Graph], Schonfeld & Associates, June 15, 2015. [Online]. Available: https://www.statista.com/statistics/471200/ad-spend-to-sales-amusement-parks-usa/