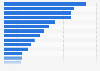
As of 2019, a panel of CIO’s and senior technology professionals reported that, on average, around 23 percent of their organization’s annual IT budget was allocated towards quality assurance and testing. The average budget share allocated towards quality assurance and testing has been decreasing in recent years, since hitting a high of 35 percent in 2015.
Quality assurance and testing in IT
The goal of investing into quality assurance and testing is to ensure that a company’s IT products are delivered in a way that is secure and without defects. Ever-increasing levels of digitalization have given companies access to massive amounts of consumer data. Although this data is beneficial from a market research point of view, it also presents companies with the responsibility of ensuring that the customer data is secure. As of 2017, more than half of companies are utilizing cloud-based test environments to test IT security. The biggest challenge associated with IT quality assurance and testing is often related to its cost. With the average organization spending over a quarter of its IT budget to fund these functions, it is not surprise that they are seeking to lower theses costs.
Proportion of budget allocated to quality assurance and testing as a percentage of IT spend from 2012 to 2019
Characteristic
Proportion of IT budget
-
-
-
-
-
-
-
-
-
-
-
-
-
-
-
-
Exclusive Premium Statistic
To access all Premium Statistics, you need a paid Statista Account
Profit from the additional features of your individual account
Currently, you are using a shared account. To use individual functions (e.g., mark statistics as favourites, set
statistic alerts) please log in with your personal account.
If you are an admin, please authenticate by logging in again.
Learn more about how Statista can support your business.
Capgemini, & Sogeti, & Website (techbeacon.com), & HPE, & Micro Focus. (October 31, 2019). Proportion of budget allocated to quality assurance and testing as a percentage of IT spend from 2012 to 2019 [Graph]. In Statista. Retrieved July 27, 2024, from https://www.statista.com/statistics/500641/worldwide-qa-budget-allocation-as-percent-it-spend/
Capgemini, und Sogeti, und Website (techbeacon.com), und HPE, und Micro Focus. "Proportion of budget allocated to quality assurance and testing as a percentage of IT spend from 2012 to 2019." Chart. October 31, 2019. Statista. Accessed July 27, 2024. https://www.statista.com/statistics/500641/worldwide-qa-budget-allocation-as-percent-it-spend/
Capgemini, Sogeti, Website (techbeacon.com), HPE, Micro Focus. (2019). Proportion of budget allocated to quality assurance and testing as a percentage of IT spend from 2012 to 2019. Statista. Statista Inc.. Accessed: July 27, 2024. https://www.statista.com/statistics/500641/worldwide-qa-budget-allocation-as-percent-it-spend/
Capgemini, and Sogeti, and Website (techbeacon.com), and HPE, and Micro Focus. "Proportion of Budget Allocated to Quality Assurance and Testing as a Percentage of It Spend from 2012 to 2019." Statista, Statista Inc., 31 Oct 2019, https://www.statista.com/statistics/500641/worldwide-qa-budget-allocation-as-percent-it-spend/
Capgemini & Sogeti & Website (techbeacon.com) & HPE & Micro Focus, Proportion of budget allocated to quality assurance and testing as a percentage of IT spend from 2012 to 2019 Statista, https://www.statista.com/statistics/500641/worldwide-qa-budget-allocation-as-percent-it-spend/ (last visited July 27, 2024)
Proportion of budget allocated to quality assurance and testing as a percentage of IT spend from 2012 to 2019 [Graph], Capgemini, & Sogeti, & Website (techbeacon.com), & HPE, & Micro Focus, October 31, 2019. [Online]. Available: https://www.statista.com/statistics/500641/worldwide-qa-budget-allocation-as-percent-it-spend/