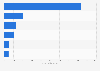
- Media & Advertising›
- Video Games & Gaming›
Weekly time spent with video games worldwide 2019, by age
Industry-specific and extensively researched technical data (partially from exclusive partnerships).
A paid subscription is required for full access.
Weekly time spent with video games worldwide 2019, by age
Average weekly time spent playing video games worldwide in 2018 and 2019, by age (in hours)

Average weekly time spent playing video games worldwide in 2018 and 2019, by age (in hours)
2018 | 2019 | |
---|---|---|
- | - | - |
- | - | - |
- | - | - |
- | - | - |
- | - | - |
- | - | - |
2018 | 2019 | |
---|---|---|
- | - | - |
- | - | - |
- | - | - |
- | - | - |
- | - | - |
- | - | - |
You need a Premium Account for unlimited access.
Full access to 1m statistics
Incl. source references
Available to download in PNG, PDF, XLS format
You need a Premium Account for unlimited access.
Full access to 1m statistics
Incl. source references
Available to download in PNG, PDF, XLS format
© Statista 2019
About this statistic
Show source
Please be patient - this may take a moment
Description
Source
More information
- Show sources information
- Show publisher information
- Release date
- March 2019
- Region
- Worldwide
- Survey time period
- 2018 and 2019
- Number of respondents
- 4,500*
- Age group
- 18 years and older
- Supplementary notes
- * Consumer panels in France, Germany, India, Italy, Japan, Singapore, South Korea, the United Kingdom, and the United States. 500 responses were collected from each country
Source
- Show sources information
- Show publisher information
- Release date
- March 2019
More information
- Region
- Worldwide
- Survey time period
- 2018 and 2019
- Number of respondents
- 4,500*
- Age group
- 18 years and older
- Supplementary notes
- * Consumer panels in France, Germany, India, Italy, Japan, Singapore, South Korea, the United Kingdom, and the United States. 500 responses were collected from each country
You only have access to basic statistics.
This statistic is not included in your account!
- Instant access to 1m statistics
- Download in XLS, PDF & PNG format
- Detailed references
$59 / Month *
Corporate solution including all features.
Prices do not include sales tax.


Statista is a great source of knowledge, and pretty helpful to manage the daily work.Christof Baron
CEO, MindShare Germany
- Industry overview
- Games market revenue worldwide from 2015 to 2019, by region (in billion U.S. dollars)Games market revenue worldwide 2015-2019, by region
- Share of games market revenue worldwide in 2019, by regionGames market revenue share worldwide 2019, by region
- Share of worldwide eSports market revenue in 2019, by regionGlobal eSports market revenue share 2019, by region
- Number of video gamers worldwide in 2018, by region (in millions)Number of video gamers worldwide 2018, by region
- Leading ten gaming markets in Asia-Pacific as of January 2019, by revenue (in million U.S. dollars)Game revenue in selected Asia-Pacific countries in 2019
- Leading gaming markets in Asia as of October 2019, by gaming revenue (in million U.S. dollars)Leading gaming markets in Asia 2019, by revenue
- Largest markets
- Video game industry revenue in China from 2008 to 2018 (in billion yuan)Video game revenue in China 2008-2018
- Video game revenue in China from 2010 to 2019 (in billion U.S. dollars)Video game revenue in China 2010-2019
- Forecast of Video Games users by segment in China from 2017 to 2023 (in million)Forecast of Video Games users by segment in China 2017-2023
- China's domestically developed video game revenue from 1st half 2008 to 1st half 2019 (in billion yuan)Domestically developed video game revenue China H1 2008 - H1 2019
- Size of the gaming market in South Korea from 2006 to 2020 (in trillion South Korean won)Gaming industry size South Korea 2006-2020
- Sales distribution of the gaming market in South Korea in 2017, by category (in billion South Korean won)Gaming industry sales breakdown South Korea 2017, by category
- Value of the gaming industry in India from FY 2007 to FY 2024 (in billion Indian rupees)Value of the gaming industry in India 2006-2024
- Value of the console gaming market in India from 2016 to 2022 (in million U.S. dollars)Market value of console gaming in India 2016-2022
- Market leaders
- Capcom's net sales in the fiscal years 2002 to 2019 (in billion yen)Capcom's net sales from 2002 to 2019
- Capcom's net income in the fiscal years 2002 to 2019 (in billion of yen)Capcom's net income from 2002 to 2019
- Capcom consumer game unit shipments in the fiscal years 2004 to 2019 (in million units)Capcom consumer game unit shipments from 2004-2019
- Nintendo's revenue from fiscal 2014 to 2019, by region (in million Japanese yen)Nintendo revenue 2014 -2019, by region
- Nintendo's revenue from fiscal 2016 to 2019, by product (in million Japanese yen)Nintendo: revenue 2016-2019, by product
- Namco Bandai's net sales by geographic region from FY2011 to FY2019 (in million U.S. dollars)Revenue of Namco Bandai by geographic region from 2011 to 2019
- Sony's gaming entertainment & consumer electronics segment unit sales worldwide from 2012 to 2018 (in millions)*Sony unit sales of hardware entertainment systems & consumer electronics 2012-2018
- Net sales and operating income of Sony's game and network services (G&NS) in the fiscal years 2012 to 2018 (in billion yen)Sony game and network services: net sales & operating income 2012-2018
- Mobile games
- Mobile contents market value in Asia from 2011 to 2019 (in billion U.S. dollars)Mobile contents market value in Asia 2011-2020
- Mobile games revenue in Asia from 2014 to 2017 (in billion U.S. dollars)Mobile games revenue in Asia 2014-2017
- Mobile gaming revenue in selected countries in Southeast Asia (SEA) in 2016 (in million U.S. dollars)Southeast Asia mobile games revenue in selected countries 2016
- Distribution of mobile gamers in selected countries in Southeast Asia (SEA) in 2016, by age group and genderSoutheast Asia mobile gamer share in selected countries 2016, by age and gender
- Consumer expenditure on mobile games for conventional mobile phones in Japan from 2013 to 2017 (in billion Japanese yen)Mobile phone games consumer spending in Japan 2013-2017
- Distribution of mobile game downloaders in the UK in 2013, by platform
- Super Mario Run player share worldwide 2016, by age & and gender
- Leading Super Mario Run markets worldwide as of December 2016, by share of gamers
- Mobile gaming penetration in Asia 2014
- Mobile gaming apps: downloading penetration in Asia 2014
- Time gamers spent playing mobile games in the UK in 2013
- Mobile games in the U.S.: consumer spend 2014, by platform
- Mobile games in the U.S.: consumer spend 2014, by time spent
- Top 10 Android Market Places in China April 2016, by revenue coverage
- Level of Pokémon GO knowledge in Denmark 2016
- Free vs. paid mobile game usage among children in the U.S. in 2015
- Playing games online New Zealand 2007-2015
- Decision makers regarding mobile games to download for children in the U.S. in 2015
- Mobile gaming: average monthly per capita spending North America 2014, by device
- Mobile games relevant hardware purchase intent in Germany 2014-2015
- Mobile games in the U.S.: consumer spend 2014, by age
- Mobile games relevant hardware penetration in Germany 2014-2015
- Reasons for playing Pokémon GO in Sweden 2016
- Reasons for playing Pokémon GO in Norway 2016
- Games market revenue worldwide 2015-2019, by region
- Games market revenue share worldwide 2019, by region
- Global eSports market revenue share 2019, by region
- Number of video gamers worldwide 2018, by region
- Game revenue in selected Asia-Pacific countries in 2019
- Leading gaming markets in Asia 2019, by revenue
- Video game revenue in China 2008-2018
- Video game revenue in China 2010-2019
- Forecast of Video Games users by segment in China 2017-2023
- Domestically developed video game revenue China H1 2008 - H1 2019
- Gaming industry size South Korea 2006-2020
- Gaming industry sales breakdown South Korea 2017, by category
- Value of the gaming industry in India 2006-2024
- Market value of console gaming in India 2016-2022
- Market share of the gaming industry in India by game type 2016
- Video game revenue in Japan from 2008 to 2017
- Value of the game market in Japan 2015, by segment
- Forecast of Video Games users by segment in Japan 2017-2023
- Share of cross-platform gamers in Southeast Asia 2017, by country
- Southeast Asia gaming revenue share 2013-2017, by country
- Southeast Asia number of mobile gamers 2016-2021
- Capcom's net sales from 2002 to 2019
- Capcom's net income from 2002 to 2019
- Capcom consumer game unit shipments from 2004-2019
- Nintendo revenue 2014 -2019, by region
- Nintendo: revenue 2016-2019, by product
- Revenue of Namco Bandai by geographic region from 2011 to 2019
- Sony unit sales of hardware entertainment systems & consumer electronics 2012-2018
- Sony game and network services: net sales & operating income 2012-2018
- Tencent annual online games revenue 2010-2018
- GREE's annual revenue FY 2010-2019
- South Korea Netmarble's sales revenue 2015-2017
- DeNA's annual revenue FY 2011-2018
- Distribution of mobile game downloaders in the UK in 2013, by platform
- Super Mario Run player share worldwide 2016, by age & and gender
- Leading Super Mario Run markets worldwide as of December 2016, by share of gamers
- Mobile gaming penetration in Asia 2014
- Mobile gaming apps: downloading penetration in Asia 2014
- Time gamers spent playing mobile games in the UK in 2013
- Mobile games in the U.S.: consumer spend 2014, by platform
- Mobile games in the U.S.: consumer spend 2014, by time spent
- Top 10 Android Market Places in China April 2016, by revenue coverage
- Level of Pokémon GO knowledge in Denmark 2016
- Free vs. paid mobile game usage among children in the U.S. in 2015
- Playing games online New Zealand 2007-2015
- Decision makers regarding mobile games to download for children in the U.S. in 2015
- Mobile gaming: average monthly per capita spending North America 2014, by device
- Mobile games relevant hardware purchase intent in Germany 2014-2015
- Mobile games in the U.S.: consumer spend 2014, by age
- Mobile games relevant hardware penetration in Germany 2014-2015
- Reasons for playing Pokémon GO in Sweden 2016
- Reasons for playing Pokémon GO in Norway 2016
Statista offers dossiers and reports on over 170 industries. With Statista you are always able to make informed decisions and boost your work efficiency.
- Social Media
- E-Commerce
- Online Video & Entertainment
- Advertising & Marketing
- Alcoholic Beverages
- Cleaning Products
- Cosmetics & Personal Care
- Food & Nutrition
- Health & Hygiene
- International Trade
- Shopping Behavior
- Sports & Leisure
- Business Travel
- Leisure Travel
- Accomodation
- Restaurants
- Demographics
- Economy
- Education & Science
- Politics & Government
- Aviation
- Rail Transport
- Vehicles & Road Traffic
- Water Transport
You can only download this statistic as a Premium user.
As a Premium user you get access to the detailed source references and background information about this statistic.
As a Premium user you get access to background information and details about the release of this statistic.
As soon as this statistic is updated, you will immediately be notified via e-mail.
...and make my research life easier.
You need at least a Premium Account to use this feature.
This feature is limited to our corporate solutions.
Please contact us to get started with full access to dossiers, forecasts, studies and international data.
We use cookies to personalize contents and ads, offer social media features, and analyze access to our website. In your browser settings you can configure or disable this, respectively, and can delete any already placed cookies. For details, please see your browser’s Help section (by pressing F1). Please see our privacy statement for details about how we use data.