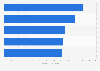
This timeline shows Nemak's distribution of the revenue generated in 2018, broken down by region. In 2018, 56 percent of the revenue generated by the company was from North America, while 35 percent was from Europe.
Distribution of revenue generated by Nemak in 2018, by region
Profit from the additional features of your individual account
Currently, you are using a shared account. To use individual functions (e.g., mark statistics as favourites, set
statistic alerts) please log in with your personal account.
If you are an admin, please authenticate by logging in again.
Learn more about how Statista can support your business.
Nemak. (February 28, 2019). Distribution of revenue generated by Nemak in 2018, by region [Graph]. In Statista. Retrieved July 27, 2024, from https://www.statista.com/statistics/715559/nemak-revenue-region/
Nemak. "Distribution of revenue generated by Nemak in 2018, by region." Chart. February 28, 2019. Statista. Accessed July 27, 2024. https://www.statista.com/statistics/715559/nemak-revenue-region/
Nemak. (2019). Distribution of revenue generated by Nemak in 2018, by region. Statista. Statista Inc.. Accessed: July 27, 2024. https://www.statista.com/statistics/715559/nemak-revenue-region/
Nemak. "Distribution of Revenue Generated by Nemak in 2018, by Region." Statista, Statista Inc., 28 Feb 2019, https://www.statista.com/statistics/715559/nemak-revenue-region/
Nemak, Distribution of revenue generated by Nemak in 2018, by region Statista, https://www.statista.com/statistics/715559/nemak-revenue-region/ (last visited July 27, 2024)
Distribution of revenue generated by Nemak in 2018, by region [Graph], Nemak, February 28, 2019. [Online]. Available: https://www.statista.com/statistics/715559/nemak-revenue-region/