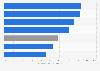
The population of Jeju-si was 495 thousand in 2022, while that of Seogwipo-si was 181 thousand. That year, the total population of Jeju stood at around 676 thousand.
Population distribution of Jeju, South Korea in 2022, by district (in 1,000 inhabitants)
Basic Account
Get to know the platform
You only have access to basic statistics.
This statistic is not included in your account.
Starter Account
The ideal entry-level account for individual users
- Instant access to 1m statistics
- Download in XLS, PDF & PNG format
- Detailed references
$229 USD $199 USD / Month *
in the first 12 months
Professional Account
Full access
Business Solutions including all features.
* Prices do not include sales tax.
Other statistics that may interest you Statistics on
About the industry
10
- Premium Statistic Population distribution of Chungnam, South Korea 2022, by district
- Premium Statistic Population distribution of Jeonbuk, South Korea 2022, by district
- Premium Statistic Population distribution of Gyeongbuk, South Korea 2022, by district
- Premium Statistic Population distribution of Incheon, South Korea 2022, by district
- Premium Statistic Population distribution of Gwangju, South Korea 2022, by district
- Premium Statistic Population distribution of Daejeon, South Korea 2022, by district
- Premium Statistic Population distribution of Ulsan, South Korea 2022, by district
- Premium Statistic Population distribution of Seoul, South Korea 2022, by district
- Premium Statistic Population distribution of Gyeonggi, South Korea 2022, by district
- Premium Statistic Population distribution of Busan, South Korea 2022, by district
About the region
10
- Premium Statistic Population distribution of Daegu, South Korea 2022, by district
- Premium Statistic Population distribution of Gangwon, South Korea 2022, by district
- Premium Statistic Population distribution of Chungbuk, South Korea 2022, by district
- Premium Statistic Administrative area of Chungbuk, South Korea 2022, by district
- Premium Statistic Administrative area of Seoul, South Korea 2022, by district
- Premium Statistic Administrative area of Gwangju, South Korea 2022, by district
- Premium Statistic Administrative area of Busan, South Korea 2022, by district
- Premium Statistic Administrative area of Ulsan, South Korea 2022, by district
- Premium Statistic Administrative area of Gyeongbuk, South Korea 2022, by district
- Premium Statistic Administrative area of Daegu, South Korea 2022, by district
Other regions
10
- Premium Statistic People living below the poverty line in Indonesia 2023, by urbanization level
- Basic Statistic Scotland: local perception of neighborhood by urban rural classification 2018
- Premium Statistic Largest megacities worldwide 2023, by land area
- Basic Statistic Urbanization in Cameroon 2012-2022
- Basic Statistic Percentage of the people in Northern Ireland with Irish and Ulster-Scots skills 2011
- Basic Statistic Planted area of rice in Italy 2018, by region
- Basic Statistic Poverty rate in Tunisia 2020, by area of residence
- Premium Statistic Area of urban regions in Jiangsu, China 2021, by city
- Premium Statistic Main sugar companies in India 2023, by market capitalization
- Premium Statistic Size of purchased homes in the U.S. 2022
Related statistics
10
- Premium Statistic Population in South Korea 2022, by province
- Premium Statistic Population of Gyeongnam, South Korea 1970-2022
- Premium Statistic Population of Incheon, South Korea 1985-2022
- Premium Statistic Population of Jeju, South Korea 1970-2022
- Premium Statistic Population of Gwangju, South Korea 1990-2022
- Premium Statistic Population of Daejeon, South Korea 1990-2022
- Premium Statistic Population of Ulsan, South Korea 2000-2022
- Premium Statistic Population of Gyeonggi, South Korea 1970-2022
- Premium Statistic Population of Gangwon, South Korea 1970-2022
- Premium Statistic Population of Chungbuk, South Korea 1970 2022
Further related statistics
9
- Internet user distribution in China 2012-H1 2023, by urban and rural region
- Cities with the largest share of parkland in the U.S. 2022
- Cities with the most parkland per 1,000 residents in the U.S. 2022
- Area of organic farming worldwide 2000-2021
- Brazil: land area use share by type 2010-2020
- Lotte World Adventure theme park attendance South Korea 2009-2022
- Mobile internet use via laptops in Great Britain 2019, by demographic
- Share of women in developing countries who were married before the age of 15
- Housing situation of gay and lesbian Americans in 2009
Further Content: You might find this interesting as well
Statistics
- Internet user distribution in China 2012-H1 2023, by urban and rural region
- Cities with the largest share of parkland in the U.S. 2022
- Cities with the most parkland per 1,000 residents in the U.S. 2022
- Area of organic farming worldwide 2000-2021
- Brazil: land area use share by type 2010-2020
- Lotte World Adventure theme park attendance South Korea 2009-2022
- Mobile internet use via laptops in Great Britain 2019, by demographic
- Share of women in developing countries who were married before the age of 15
- Housing situation of gay and lesbian Americans in 2009
KOSIS. (July 27, 2023). Population distribution of Jeju, South Korea in 2022, by district (in 1,000 inhabitants) [Graph]. In Statista. Retrieved October 03, 2023, from https://www.statista.com/statistics/756061/south-korea-population-distribution-of-jeju-by-district/
KOSIS. "Population distribution of Jeju, South Korea in 2022, by district (in 1,000 inhabitants)." Chart. July 27, 2023. Statista. Accessed October 03, 2023. https://www.statista.com/statistics/756061/south-korea-population-distribution-of-jeju-by-district/
KOSIS. (2023). Population distribution of Jeju, South Korea in 2022, by district (in 1,000 inhabitants). Statista. Statista Inc.. Accessed: October 03, 2023. https://www.statista.com/statistics/756061/south-korea-population-distribution-of-jeju-by-district/
KOSIS. "Population Distribution of Jeju, South Korea in 2022, by District (in 1,000 Inhabitants)." Statista, Statista Inc., 27 Jul 2023, https://www.statista.com/statistics/756061/south-korea-population-distribution-of-jeju-by-district/
KOSIS, Population distribution of Jeju, South Korea in 2022, by district (in 1,000 inhabitants) Statista, https://www.statista.com/statistics/756061/south-korea-population-distribution-of-jeju-by-district/ (last visited October 03, 2023)
Population distribution of Jeju, South Korea in 2022, by district (in 1,000 inhabitants) [Graph], KOSIS, July 27, 2023. [Online]. Available: https://www.statista.com/statistics/756061/south-korea-population-distribution-of-jeju-by-district/