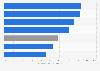
In 2019, Hong Kong was the most expensive city across the Asia Pacific region in terms of fine dining, in which the average cost of dining at a luxury restaurant was 308 U.S. dollars. Alternatively, it cost on average 96 U.S. dollars to dine at a luxury restaurant in Manila in 2019.
Average cost of fine dining in Asia Pacific in 2019, by city (in U.S. dollars)
Basic Account
Get to know the platform
You only have access to basic statistics.
This statistic is not included in your account.
Starter Account
The ideal entry-level account for individual users
- Instant access to 1m statistics
- Download in XLS, PDF & PNG format
- Detailed references
$149 USD / Month *
Professional Account
Full access
Business Solutions including all features.
* Prices do not include sales tax.
Other statistics that may interest you Statistics on
About the industry
10
- Premium Statistic Foodservice sales in fine dining restaurants in South Korea 2015-2022
- Premium Statistic Foodservice sales in quick service and fast food restaurants in South Korea 2015-2022
- Premium Statistic Foodservice sales in coffee and tea shops in South Korea 2015-2022
- Premium Statistic Luxury wines and spirits market value in Poland 2010-2020
- Premium Statistic Sales revenue of Starbucks in South Korea 2012-2022
- Premium Statistic Operating profi of Starbucks in South Korea 2012-2022
- Premium Statistic Largest restaurant franchises in Brazil 2022
- Basic Statistic United Kingdom: revenue of Fortnum & Mason 2014-2022
- Basic Statistic Gross profit of Fortnum & Mason 2010-2022
- Basic Statistic Net profit/loss of Fortnum & Mason 2010-2022
About the region
10
- Premium Statistic Cost of luxury jewelry APAC 2019 by city
- Premium Statistic Cost of luxury cars APAC 2019 by city
- Premium Statistic Cost of Lasik eye surgery APAC 2019 by city
- Premium Statistic Cost of return business class flights APAC 2019 by city
- Premium Statistic Cost of a luxury hotel room APAC 2019 by city
- Premium Statistic Cost of luxury wine APAC 2019 by city
- Premium Statistic Cost of prime real estate APAC by city 2019
- Premium Statistic Number of HNWI APAC 2011-2020
- Premium Statistic Financial wealth of HNWIs APAC 2011-2020
- Premium Statistic HNWI population APAC 2017-2019, by country
Other regions
10
- Premium Statistic Luxury goods and services prices in Moscow in 2019, by type
- Basic Statistic Richest people in Poland 2021-2022
- Basic Statistic Global net sales of Safilo Group in 20201 by geographical area
- Premium Statistic Number of UHNWIs Thailand 2016-2026
- Premium Statistic Market size of luxury goods in China 2014-2018
- Premium Statistic Value of luxury retail sales in the GCC 2016-2019
- Premium Statistic Number of billionaires APAC 2019, by city
- Premium Statistic Retail value of the Latin American luxury goods market 2014-2019
- Premium Statistic Retail value of the African luxury goods market 2014-2019
- Premium Statistic Number of centa-millionaires Sri Lanka 2006-2026
Related statistics
10
- Premium Statistic Tax gaps as a percentage of GDP in selected economies in Asia-Pacific 2014
- Premium Statistic Carbon tax impact on annual revenue in selected countries APAC 2018
- Premium Statistic Arable land APAC 2021, by country or region
- Premium Statistic Passenger car sales volume APAC 2022, by country
- Premium Statistic Passenger car sales volume APAC 2013-2022
- Premium Statistic M&A activity value in fintech APAC 2017-2022
- Premium Statistic Number of M&A deals in fintech APAC 2017-2022
- Premium Statistic Export value of kiwi fruit APAC 2020, by country
- Premium Statistic Export value of bread APAC 2020, by country
- Premium Statistic Export value of cauliflower and broccoli APAC 2020, by country
Further related statistics
6
- Average number of children of billionaires worldwide, 2013
- Total sales of the Richemont Group worldwide 2008-2023
- Number of Hugo Boss stores worldwide in 2022, by region
- Millionaires in China 2022, by region
- Number of Hugo Boss stores worldwide in 2020, by store type
- Spending on sponsorships worldwide by region 2009-2018
Further Content: You might find this interesting as well
Statistics
- Average number of children of billionaires worldwide, 2013
- Total sales of the Richemont Group worldwide 2008-2023
- Number of Hugo Boss stores worldwide in 2022, by region
- Millionaires in China 2022, by region
- Number of Hugo Boss stores worldwide in 2020, by store type
- Spending on sponsorships worldwide by region 2009-2018
Julius Bär. (January 15, 2020). Average cost of fine dining in Asia Pacific in 2019, by city (in U.S. dollars) [Graph]. In Statista. Retrieved November 29, 2023, from https://www.statista.com/statistics/798285/cost-of-fine-dining-in-selected-cities-asia-pacific/
Julius Bär. "Average cost of fine dining in Asia Pacific in 2019, by city (in U.S. dollars)." Chart. January 15, 2020. Statista. Accessed November 29, 2023. https://www.statista.com/statistics/798285/cost-of-fine-dining-in-selected-cities-asia-pacific/
Julius Bär. (2020). Average cost of fine dining in Asia Pacific in 2019, by city (in U.S. dollars). Statista. Statista Inc.. Accessed: November 29, 2023. https://www.statista.com/statistics/798285/cost-of-fine-dining-in-selected-cities-asia-pacific/
Julius Bär. "Average Cost of Fine Dining in Asia Pacific in 2019, by City (in U.S. Dollars)." Statista, Statista Inc., 15 Jan 2020, https://www.statista.com/statistics/798285/cost-of-fine-dining-in-selected-cities-asia-pacific/
Julius Bär, Average cost of fine dining in Asia Pacific in 2019, by city (in U.S. dollars) Statista, https://www.statista.com/statistics/798285/cost-of-fine-dining-in-selected-cities-asia-pacific/ (last visited November 29, 2023)
Average cost of fine dining in Asia Pacific in 2019, by city (in U.S. dollars) [Graph], Julius Bär, January 15, 2020. [Online]. Available: https://www.statista.com/statistics/798285/cost-of-fine-dining-in-selected-cities-asia-pacific/