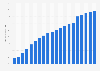
This statistic shows the share of food delivery app users in China in June 2018, by city tier. That month, around 12 percent of food delivery app users in China were in first-tier cities.
Share of food delivery app users in China in June 2018, by city tier
Basic Account
Get to know the platform
You only have access to basic statistics.
This statistic is not included in your account.
Starter Account
The ideal entry-level account for individual users
- Instant access to 1m statistics
- Download in XLS, PDF & PNG format
- Detailed references
$199 USD / Month *
Professional Account
Full access
Business Solutions including all features.
* Prices do not include sales tax.
Other statistics that may interest you Statistics on
About the industry
10
- Premium Statistic Average daily time spent per user on food delivery apps in China H1 2018, by gender
- Premium Statistic Average daily time spent per user on food delivery apps in China H1 2018
- Premium Statistic Food delivery apps' monthly active users in China H1 2018
- Premium Statistic Most downloaded grocery delivery apps in the U.S. 2022
- Premium Statistic Preferred alcoholic beverages in U.S. 2019, by gender
- Premium Statistic Type of food ordered on delivery apps in Indonesia 2023
- Premium Statistic Change of food delivery apps usage during COVID-19 pandemic in Singapore 2023
- Premium Statistic Eating out: Weekly UK consumption of meat and meat products 2006-2021
- Premium Statistic Eating out: Weekly consumption of salads in the United Kingdom (UK) 2006-2021
- Premium Statistic Eating out: Weekly consumption of carcass meat in the United Kingdom (UK) 2006-2021
About the region
10
- Premium Statistic Major reasons for consumers to order food delivery in China 2020
- Premium Statistic Revenue of the eServices market in China 2019-2028, by segment
- Premium Statistic Number of users in the eServices market in China 2019-2028, by segment
- Premium Statistic Most used food delivery apps in China 2023
- Premium Statistic Pinduoduo's monthly active user number Q1 2019-Q1 2022
- Premium Statistic Discrimination faced by employed people in China 2024, by gender
- Premium Statistic Pinduoduo's annual GMV 2018-2021
- Premium Statistic Chinese population with hair loss problems 2020, by gender
- Premium Statistic Gender distribution of video gamers in China 2015-2019
- Basic Statistic Most valuable Chinese lifestyle platform brands according to BrandZ 2020
Other regions
10
- Premium Statistic Most popular m-commerce apps in Brazil 2023
- Premium Statistic Survey on usage frequency of food/shopping list apps in Norway 2016
- Basic Statistic Global revenue of European food delivery companies 2018
- Premium Statistic Ashley Madison: current and past usage in the United Kingdom (UK) 2017, by gender
- Premium Statistic Mobile apps: user retention rate 2012-2019
- Premium Statistic Italy: suggestions to improve food delivery services 2018
- Premium Statistic Coronavirus impact on U.S. app downloads as of March 2020, by category
- Premium Statistic Online food delivery orders after the Covid-19 outbreak in France in 2020, by gender
- Premium Statistic Online food delivery revenue Indonesia 2018-2028, by segment
- Premium Statistic Thailand: online food delivery penetration rate 2023, by segment
Related statistics
10
- Premium Statistic Shopping items more often bought on mobile devices than PCs in China 2019
- Premium Statistic Number of people working in retail in Hong Kong 2015-2022, by gender
- Premium Statistic Export value of China's top six provinces and municipalities 2022
- Premium Statistic Share of total exports of China's leading six provinces and municipalities 2022
- Premium Statistic Xiaohongshu's active user gender breakdown 2023
- Premium Statistic Number of monthly active users of fresh commerce in China 2022, by platform
- Premium Statistic Penetration rate of online shopping in China 2013-2023
- Premium Statistic Share of processed food and beverage exports from Hong Kong by end market 2022
- Premium Statistic Share of processed food and beverage exports from Hong Kong by category 2022
- Premium Statistic Share of leading O2O food takeaway companies in China 2020
Further related statistics
10
- Mobile internet use via laptops in Great Britain 2019, by demographic
- Internet user distribution in China 2012-H1 2023, by urban and rural region
- Alpine skiing participation in U.S. high schools 2010-2022, by gender
- Number of China Unicom fixed phone lines 2011-2021
- Attitudes towards calories/fat content in Great Britain in 2017
- Food items adults eat more of when trying to be healthier in Great Britain 2017
- Online advertising of companies in China 2016
- Total population of Myanmar in 2014, by gender
- Frequency of buying a ‘meal deal’ from the supermarket in Great Britain 2013
- Employment to population ratio in 2012, by region and gender
Further Content: You might find this interesting as well
Statistics
- Mobile internet use via laptops in Great Britain 2019, by demographic
- Internet user distribution in China 2012-H1 2023, by urban and rural region
- Alpine skiing participation in U.S. high schools 2010-2022, by gender
- Number of China Unicom fixed phone lines 2011-2021
- Attitudes towards calories/fat content in Great Britain in 2017
- Food items adults eat more of when trying to be healthier in Great Britain 2017
- Online advertising of companies in China 2016
- Total population of Myanmar in 2014, by gender
- Frequency of buying a ‘meal deal’ from the supermarket in Great Britain 2013
- Employment to population ratio in 2012, by region and gender
iResearch. (August 15, 2018). Share of food delivery app users in China in June 2018, by city tier [Graph]. In Statista. Retrieved March 29, 2024, from https://www.statista.com/statistics/896804/china-share-of-food-delivery-app-users-by-city-tier/
iResearch. "Share of food delivery app users in China in June 2018, by city tier." Chart. August 15, 2018. Statista. Accessed March 29, 2024. https://www.statista.com/statistics/896804/china-share-of-food-delivery-app-users-by-city-tier/
iResearch. (2018). Share of food delivery app users in China in June 2018, by city tier. Statista. Statista Inc.. Accessed: March 29, 2024. https://www.statista.com/statistics/896804/china-share-of-food-delivery-app-users-by-city-tier/
iResearch. "Share of Food Delivery App Users in China in June 2018, by City Tier." Statista, Statista Inc., 15 Aug 2018, https://www.statista.com/statistics/896804/china-share-of-food-delivery-app-users-by-city-tier/
iResearch, Share of food delivery app users in China in June 2018, by city tier Statista, https://www.statista.com/statistics/896804/china-share-of-food-delivery-app-users-by-city-tier/ (last visited March 29, 2024)
Share of food delivery app users in China in June 2018, by city tier [Graph], iResearch, August 15, 2018. [Online]. Available: https://www.statista.com/statistics/896804/china-share-of-food-delivery-app-users-by-city-tier/